

Population Genetic Structure and Contribution of Philippine Chickens to the Pacific Chicken Diversity Inferred From Mitochondrial DNA
- PMID: 34367257
- PMCID: PMC8340678
- DOI: 10.3389/fgene.2021.698401
Population Genetic Structure and Contribution of Philippine Chickens to the Pacific Chicken Diversity Inferred From Mitochondrial DNA
Abstract
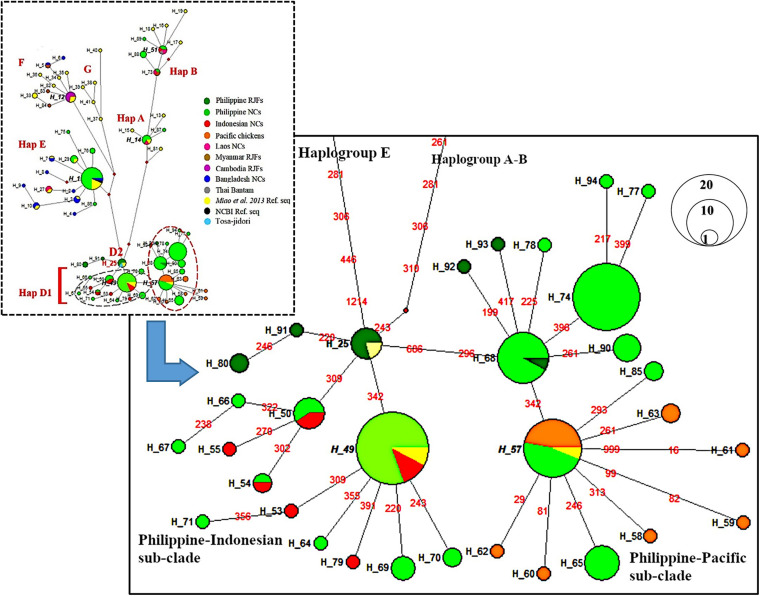
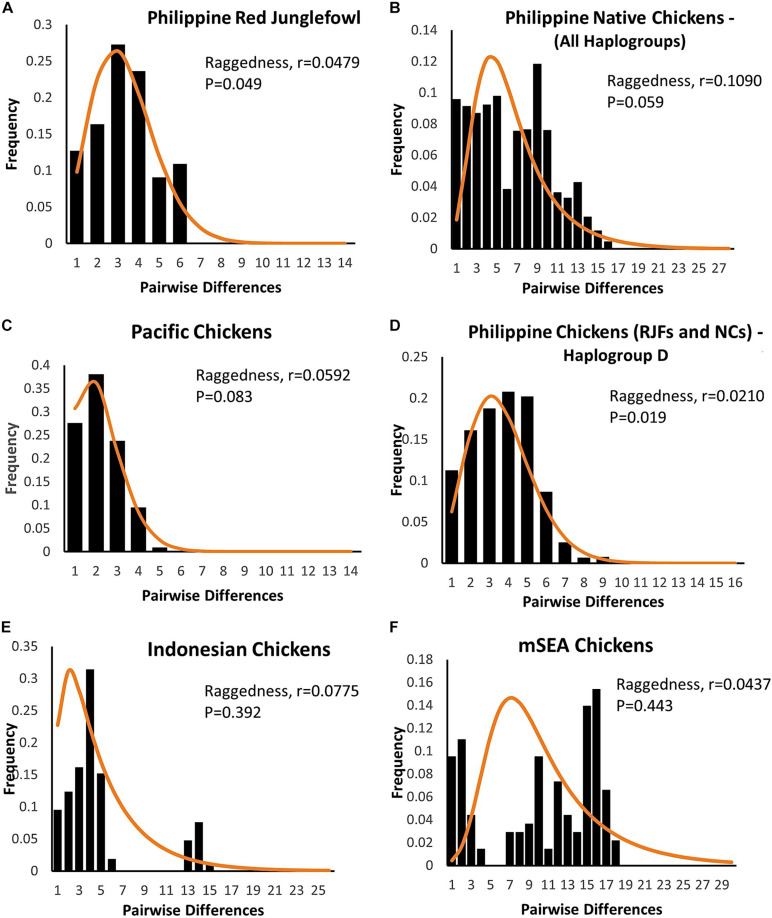
The Philippines is considered one of the biodiversity hotspots for animal genetic resources. In spite of this, population genetic structure, genetic diversity, and past population history of Philippine chickens are not well studied. In this study, phylogeny reconstruction and estimation of population genetic structure were based on 107 newly generated mitochondrial DNA (mtDNA) complete D-loop sequences and 37 previously published sequences of Philippine chickens, consisting of 34 haplotypes. Philippine chickens showed high haplotypic diversity (Hd = 0.915 ± 0.011) across Southeast Asia and Oceania. The phylogenetic analysis and median-joining (MJ) network revealed predominant maternal lineage haplogroup D classified throughout the population, while support for Philippine-Pacific subclade was evident, suggesting a Philippine origin of Pacific chickens. Here, we observed Philippine red junglefowls (RJFs) at the basal position of the tree within haplogroup D indicating an earlier introduction into the Philippines potentially via mainland Southeast Asia (MSEA). Another observation was the significantly low genetic differentiation and high rate of gene flow of Philippine chickens into Pacific chicken population. The negative Tajima's D and Fu's Fs neutrality tests revealed that Philippine chickens exhibited an expansion signal. The analyses of mismatch distribution and neutrality tests were consistent with the presence of weak phylogeographic structuring and evident population growth of Philippine chickens (haplogroup D) in the islands of Southeast Asia (ISEA). Furthermore, the Bayesian skyline plot (BSP) analysis showed an increase in the effective population size of Philippine chickens, relating with human settlement, and expansion events. The high level of genetic variability of Philippine chickens demonstrates conservation significance, thus, must be explored in the future.
Keywords: Gallus gallus; Philippine chickens; demographic history; genetic structure; mtDNA; phylogeography.
Copyright © 2021 Godinez, Dadios, Espina, Matsunaga and Nishibori.
Conflict of interest statement
The authors declare that the research was conducted in the absence of any commercial or financial relationships that could be construed as a potential conflict of interest.
Figures


Similar articles
-
Unveiling new perspective of phylogeography, genetic diversity, and population dynamics of Southeast Asian and Pacific chickens.Sci Rep. 2022 Aug 26;12(1):14609. doi: 10.1038/s41598-022-18904-3. Sci Rep. 2022. PMID: 36028749 Free PMC article.
-
Analysis of the mtDNA D-loop Region Casts New Light on Philippine Red Junglefowl Phylogeny and Relationships to Other Junglefowl Species in Asia.J Poult Sci. 2022 Oct 25;59(4):305-315. doi: 10.2141/jpsa.0210140. J Poult Sci. 2022. PMID: 36382062 Free PMC article.
-
Phylogenetic Studies on Red Junglefowl (Gallus gallus) and Native Chicken (Gallus gallus domesticus) in Samar Island, Philippines using the Mitochondrial DNA D-Loop Region.J Poult Sci. 2019 Oct 25;56(4):237-244. doi: 10.2141/jpsa.0180131. J Poult Sci. 2019. PMID: 32055220 Free PMC article.
-
Uganda chicken genetic resources: II. genetic diversity and population demographic history inferred from mitochondrial DNA D-loop sequences.Front Genet. 2024 Mar 7;15:1325569. doi: 10.3389/fgene.2024.1325569. eCollection 2024. Front Genet. 2024. PMID: 38516375 Free PMC article.
-
Genetic structure, population diversity and ancestry of Nicobari fowl based on mtDNA complete D-loop sequences.J Genet. 2022;101:31. J Genet. 2022. PMID: 35975815
Cited by
-
Studying Genetic Diversity and Relationships between Mountainous Meihua Chickens Using Mitochondrial DNA Control Region.Genes (Basel). 2023 Apr 28;14(5):998. doi: 10.3390/genes14050998. Genes (Basel). 2023. PMID: 37239358 Free PMC article.
-
Origin and Demographic History of Philippine Pigs Inferred from Mitochondrial DNA.Front Genet. 2022 Jan 25;12:823364. doi: 10.3389/fgene.2021.823364. eCollection 2021. Front Genet. 2022. PMID: 35145546 Free PMC article.
-
The Complete Mitochondrial Genome and Phylogenetic Analyses of To Chicken in Vietnam.Genes (Basel). 2023 May 15;14(5):1088. doi: 10.3390/genes14051088. Genes (Basel). 2023. PMID: 37239448 Free PMC article.
-
Unveiling new perspective of phylogeography, genetic diversity, and population dynamics of Southeast Asian and Pacific chickens.Sci Rep. 2022 Aug 26;12(1):14609. doi: 10.1038/s41598-022-18904-3. Sci Rep. 2022. PMID: 36028749 Free PMC article.
-
Analysis of the mtDNA D-loop Region Casts New Light on Philippine Red Junglefowl Phylogeny and Relationships to Other Junglefowl Species in Asia.J Poult Sci. 2022 Oct 25;59(4):305-315. doi: 10.2141/jpsa.0210140. J Poult Sci. 2022. PMID: 36382062 Free PMC article.
References
-
- Adebambo A. O., Mobegi V. A., Mwacharo J. M., Oladejo B. M., Adewale R. A., Ilori L. O., et al. (2010). Lack of phylogeographic structure in Nigerian village chickens revealed by mitochondrial DNA D-loop sequence analysis. Int. J. Poult. Sci. 9 503–507. 10.3923/ijps.2010.503.507 - DOI
-
- Alexander M., Ho S. Y., Molak M., Barnett R., Carlborg Ö, Dorshorst B., et al. (2015). Mitogenomic analysis of a 50-generation chicken pedigree reveals a rapid rate of mitochondrial evolution and evidence for paternal mtDNA inheritance. Biol. Lett. 11:20150561. 10.1098/rsbl.2015.0561 - DOI - PMC - PubMed
-
- Austerlitz F., Jung-Muller B., Godelle B., Gouyon P. H. (1997). Evolution of coalescence times, genetic diversity and structure during colonization. Theor. Popul. Biol. 51 148–164. 10.1006/tpbi.1997.1302 - DOI
LinkOut - more resources
Full Text Sources
Miscellaneous