. 2021 Aug;15(4):675-692.
doi: 10.1007/s11571-020-09652-z. Epub 2020 Nov 17.

Memory retention in pyramidal neurons: a unified model of energy-based homo and heterosynaptic plasticity with homeostasis

Affiliations

Memory retention in pyramidal neurons: a unified model of energy-based homo and heterosynaptic plasticity with homeostasis

Huanwen Chen et al. Cogn Neurodyn. 2021 Aug.

Abstract

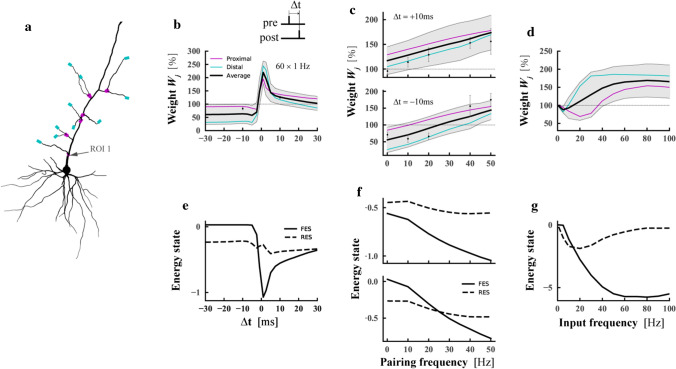
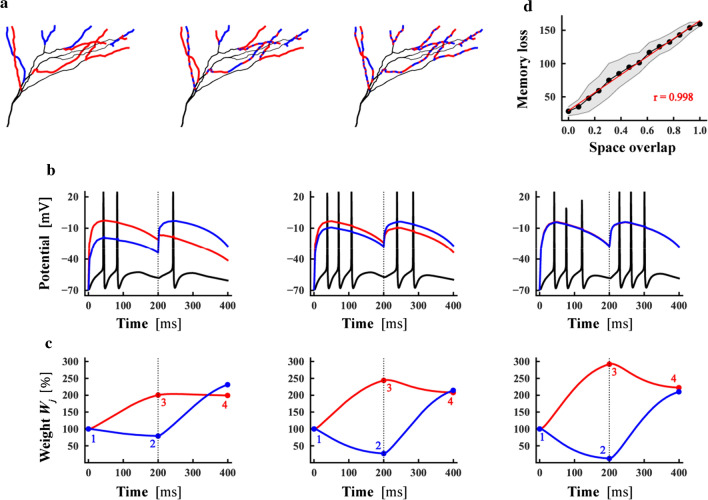
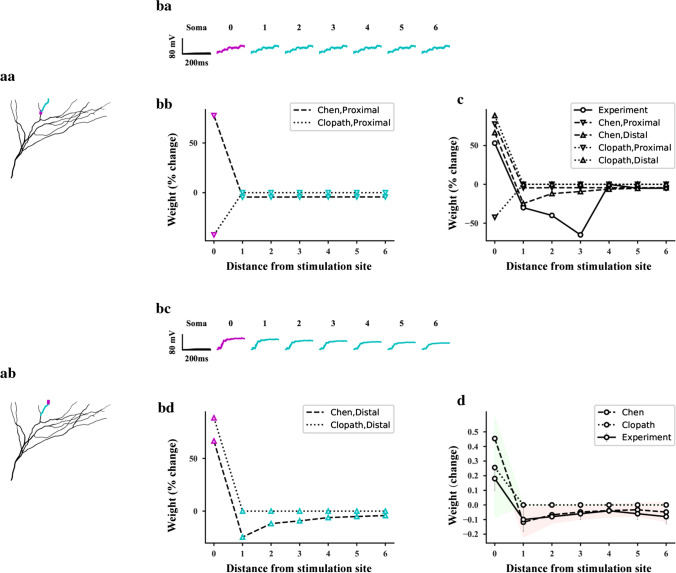
The brain can learn new tasks without forgetting old ones. This memory retention is closely associated with the long-term stability of synaptic strength. To understand the capacity of pyramidal neurons to preserve memory under different tasks, we established a plasticity model based on the postsynaptic membrane energy state, in which the change in synaptic strength depends on the difference between the energy state after stimulation and the resting energy state. If the post-stimulation energy state is higher than the resting energy state, then synaptic depression occurs. On the contrary, the synapse is strengthened. Our model unifies homo- and heterosynaptic plasticity and can reproduce synaptic plasticity observed in multiple experiments, such as spike-timing-dependent plasticity, and cooperative plasticity with few and common parameters. Based on the proposed plasticity model, we conducted a simulation study on how the activation patterns of dendritic branches by different tasks affect the synaptic connection strength of pyramidal neurons. We further investigate the formation mechanism by which different tasks activate different dendritic branches. Simulation results show that compare to the classic plasticity model, the plasticity model we proposed can achieve a better spatial separation of different branches activated by different tasks in pyramidal neurons, which deepens our insight into the memory retention mechanism of brains.

Keywords: Homo- and heterosynaptic plasticity; Memory retention; Metabolic energy; Neural computation; Pyramidal neuron.


Conflict of interest statement

Conflict of interestThe authors declare that they have no conflict of interest.

Figures

Fig. 1
Fig. 1
Illustration of the model. a Relationship between postsynaptic membrane potential vm and driving potential fjvm. The farther vm was from the driving threshold potential θl, the larger the amplitude of the driving voltage (black solid line) would be, but fjvm had the same sign as vm. A transformation of the driving voltage (the dashed red line) stayed the same for vm<θh and opposite sign occurred for vmθh, reminiscent of the scalar function ϕ in the BCM model (Bienenstock et al. 1982). b Relationship between postsynaptic membrane current density Im and driving current gjIm. The amplitude of gjIm decreased exponentially if the amplitude of Im was larger than the allowable maximum current density Imax. c The instantaneous change in the synaptic strength under different postsynaptic membrane potential and membrane current density. The synaptic strength increased in D, E, and F but decreased in R, S, and T. d, e Postsynaptic membrane potential, membrane current density, energy state, and weight change with time for the classical STDP protocol. Red traces: vmθh; insets: zoom in on the red curve. The synaptic strength potentiated for a pre–post spike pair d and depressed for a post–pre spike pair e mainly due to the difference in the current density of the postsynaptic membrane. The electric power represent the curves of dEjrdt and dEjdt with time, respectively. Because dEjdt=0 at vm<θh and dEjrdt=0 at vmθh, the overall effect is equivalent to dEjrdt+dEjdt. The last line (weight) represents dEjrdt-dEjdt. The integral (shaded part) of the red curve in the third line (electrical power) should be negative in the weight representation
Fig. 2
Fig. 2
Verifying our model with classical plasticity experimental data. a Proximal (magenta) and distal (cyan) locations on a thin apical branch of the detailed neuron model. b, c, d Changes in the mean synaptic strength of the distal compartments of dendrites (cyan curve), proximal compartments (magenta curve), and all compartments (black curve) under different induction protocols. The gray shaded regions represented the standard deviation of synaptic strength for all compartments. b Synaptic weight change for different time intervals Δt between pre- and postsynaptic firing by using 60 pre–post pairs at 1 Hz. Dots indicated data from Wang et al. (2005). c Weight change as a function of pairing repetition frequency using pairings with a time delay of +10 ms (pre-post, top) and –10 ms (post–pre, bottom). Dots were data from Sjöström et al. (2001) d Weight change as a function of afferent frequency. A group of synapses on a proximal compartment or distal compartment were activated by a Poisson process. e, f, g Dynamics of the mean firing energy state (FES, solid line) and the mean resting energy state (RES, dashed line). The stimulation protocols used by e, f, and g were the same as b, c, and d respectively
Fig. 3
Fig. 3
Verifying our model with the triplet and quadruplet experimental data. Each protocol was repeated 60 times with a frequency of 1 Hz for apical compartments (Fig. 2a). Black bars and dots represented the experimental data from Wang et al. (2005) and Table 2 in Pfister and Gerstner (2006). a, b Synaptic weight changes under triplet protocol. Magenta bars: average synaptic weights for proximal compartments, cyan bars: average synaptic weights for distal compartments. a Synaptic strength changes corresponding to different time intervals under the four pre–post–pre protocols. Each protocol consisted of two presynaptic spikes and one postsynaptic spike characterized by Δt1=tpost-t1pre and Δt2=tpost-t2pre where t1pre and t2pre were the first and second presynaptic spikes of the triplet. b Synaptic strength changes corresponding to different time intervals under the four post–pre–post protocols. Each protocol consisted of one presynaptic spike and two postsynaptic spikes. In this case, Δt1=t1post-tpre and Δt2=t2post-tpre where t1post and t2post were the first and second postsynaptic spikes of the triplet. c Synaptic weight change as a function of a delayed time T under the quadruplet protocol. Magenta line corresponded to the average synaptic weights of proximal compartments, cyan line corresponded to the average synaptic weights of distal compartments, and black line corresponded to the average synaptic weights of all compartments. The gray shaded regions represented the standard deviation of synaptic strength for all compartments
Fig. 4
Fig. 4
Effect of spatial overlap on memory retention of apical tuft dendrites in L5 pyramidal neurons. The activation time for each task was 50 ms. a Synaptic connection patterns for different spatial overlaps. Seven of the 13 thin branches were connected to task 1, and the six other ones were connected to task 2 with the spatial overlap of 0 (left). When the spatial overlap was close to 0.5 (middle), each of the six branches was connected to different tasks, and four of the remaining 7 branches were connected to tasks 1 and 3 were connected to task 2. Each of the 13 thin branches connected the two different tasks with the spatial overlap of 1 (right). b The change in the postsynaptic potential with time under the connection patterns of (a). The black curve represented the membrane potential of the postsynaptic cell body, the red curve indicated the mean value of the postsynaptic local membrane potential corresponding to task 1, and the blue curve represented the mean value of the postsynaptic local membrane potential corresponding to task 2. The left, middle, and right corresponded to the left, middle, and right of (a), respectively. c Evolution of synaptic weight. The execution of task 1 before the start of task 2 (vertical dot line) not only caused a change in its own synaptic strength (red) but also caused a change in the average synaptic strength of task 2 (blue, 1 to 2). The execution of task 2 changed its own synaptic strength (blue), and at the same time changed the average synaptic strength corresponding to task 1 (red, 3 to 4). The left, middle, and right corresponded to the left, middle, and right of (a) respectively. d Memory loss as a function of the spatial overlap. The black dots and shadow represented the mean and variance of memory loss of each spatial overlap under 10 different connection patterns. r: Pearson correlation. The red line was a linear fitting of average memory loss
Fig. 5
Fig. 5
Effect of temporal overlap on memory retention of apical tuft dendrites in L5 pyramidal neurons. The activation time for each task was 50 ms. Space overlap was zero. a Connection pattern of different tasks to the apical tuft dendrites. Seven of the 13 thin branches were connected to task 1, and the six other ones were connected to task 2. b Evolution of postsynaptic potential. Black, red, and blue lines indicated the average postsynaptic potentials for soma, task 1, and task 2, respectively. The start time of the second task (vertical dotted line) was 200 ms with the temporal overlap of 0 (left), the start time of the second task was 100 ms with the temporal overlap of 0.5 (middle), and the second task and the first task started simultaneously with the temporal overlap of 1 (right). c Evolution of synaptic weight. The execution of task 1 before the start of task 2 (vertical dot line) changed not only its own synaptic strength (red) but also the average synaptic strength of task 2 (blue, 1 to 2). The execution of task 2 changed its own synaptic strength (blue), and at the same time changed the average synaptic strength corresponding to task 1 (red, 3 to 4). t1, t2: the start time of task 1 and task2, respectively, T: the period of each task, Δt: the delay between two tasks activated, and Δto: the overlapping time between two tasks. The temporal overlap was 0 with t2=200ms (left), the temporal overlap was 0.5 with t2=100ms (middle), and the temporal overlap was 1 with t2=0ms and overlap of point 1 and 2 (right). d Memory lost as a function of the temporal overlap. The black dots and shadow represented the mean and variance of memory loss of each spatial overlap under 10 different connection patterns respectively. The red line was a linear fitting of average memory loss. r: Pearson correlation
Fig. 6
Fig. 6
Comparison between model simulation and experiment in the basal region of pyramidal neurons. a Stimulation on a branch of pyramidal neurons. 0-6 represent the numbers of the compartments and the distance between the compartments and the stimulated site. magenta: stimulated site, cyan: unstimulated site. (aa) proximal stimulated site. (ab) distal stimulated site. (ba) The somatic action potential and the postsynaptic depolarization potential of each compartment during proximal stimulation. (bb) Changes of synaptic strength in each compartment after the proximal stimulation. (bc, bd) Same as (ba) and (bb) respectively, but for the distal stimulation. (c) The change of synaptic strength in each compartment shown in (aa) and (ab). (d) Changes of mean synaptic connection strength after stimulation for all branches in the basal region. The data in 0, 1 and 2 sites in the experiment (Fig. 3Ab, Ac in Royer and Paré 2003) were averaged as the experimental data of compartment 0. In the model simulation, the compartments in each branch were divided into 7 groups corresponding to the site distance of 0-6, and then the data of synaptic strength of each group were averaged. The gray error bar represents the experimental standard deviation, the red shaded area represents the standard deviation of our model simulation, and the green shaded area represents the standard deviation of Clopath’s model simulation
Fig. 7
Fig. 7
Comparison between model simulation and experiment in the tuft region of pyramidal neurons. a Stimulation on a branch of pyramidal neurons. 0–6 represent the numbers of the compartments and the distance between the compartments and the stimulated site. magenta: stimulated site, cyan: unstimulated site. aa proximal stimulated site. ab distal stimulated site. ba The somatic action potential and the postsynaptic depolarization potential of each compartment during proximal stimulation. bb Changes of synaptic strength in each compartment after the proximal stimulation. bc, bd Same as ba and bb respectively, but for the distal stimulation. c The change of synaptic strength in each compartment shown in aa and ab. d Changes of mean synaptic connection strength after stimulation for all branches in the tuft region. The data in 0, 1 and 2 sites in the experiment (Fig. 3Ab, Ac in Royer and Paré 2003) were averaged as the experimental data of compartment 0. In the model simulation, the compartments in each branch were divided into 7 groups corresponding to the site distance of 0-6, and then the data of synaptic strength of each group were averaged. The gray error bar represents the experimental standard deviation, the red shaded area represents the standard deviation of our model simulation, and the green shaded area represents the standard deviation of Clopath’s model simulation
Fig. 8
Fig. 8
Automatic transformation of spatial overlap from 1 to 0. a Random synaptic connections in the basal region of pyramidal neurons of the two corresponding tasks before our stimulation protocol. magenta: synaptic connections for task 1, cyan: synaptic connections for task 2. nCon is the compartment number of the synaptic connections after learning, and nDiscon is the compartment number of the clipped synaptic connections. wCon is the average connection strength (weight) of the unclipped synapses, while wDiscon is the average connection strength (weight) of the clipped synapses. Top and bottom panels: two different initial synaptic connections that were randomly generated. ba Based on our model, the distribution of synaptic connections in the basal regions after our stimulation protocol was implemented. bb Based on our model, the distribution of synaptic weights in the basal regions after our stimulation protocol was implemented. c Same as b, but based on the Clopath’s model. d, e, f Same as a, b, c, but for the apical tuft region in pyramidal neurons

Similar articles

References

    1. Abraham WC, Goddard GV. Asymmetric relations between homosynaptic long-term potentiation and heterosynaptic long-term depression. Nature. 1983;305:717–719. doi: 10.1038/305717a0. - DOI - PubMed
    1. Abraham WC, Robins A. Memory retention-the synaptic stability versus plasticity dilemma. Trends Neurosci. 2005;28:73–78. doi: 10.1016/j.tins.2004.12.003. - DOI - PubMed
    1. Abraham WC, Logan B, Wolff A, Benuskova L. Heterosynaptic. LTD in the dentate gyrus of anesthetized rat requires homosynaptic activity, J Neurophysiol. 2007;98(2):1048–1051. - PubMed
    1. Attwell D, Laughlin SB. An energy budget for signaling in the grey matter of the brain. J Cereb Blood Flow Metab. 2001;21:1133–1145. doi: 10.1097/00004647-200110000-00001. - DOI - PubMed
    1. Benna MK, Fusi S. Computational principles of synaptic memory consolidation. Nat Neurosci. 2016;19(2):1697–1706. doi: 10.1038/nn.4401. - DOI - PubMed

LinkOut - more resources