. 2021 Jul 27:2021:3260789.
doi: 10.1155/2021/3260789. eCollection 2021.

Spirulina platensis Consumption Prevents Obesity and Improves the Deleterious Effects on Intestinal Reactivity in Rats Fed a Hypercaloric Diet

Affiliations

Spirulina platensis Consumption Prevents Obesity and Improves the Deleterious Effects on Intestinal Reactivity in Rats Fed a Hypercaloric Diet

Anderson Fellyp Avelino Diniz et al. Oxid Med Cell Longev. .

Abstract

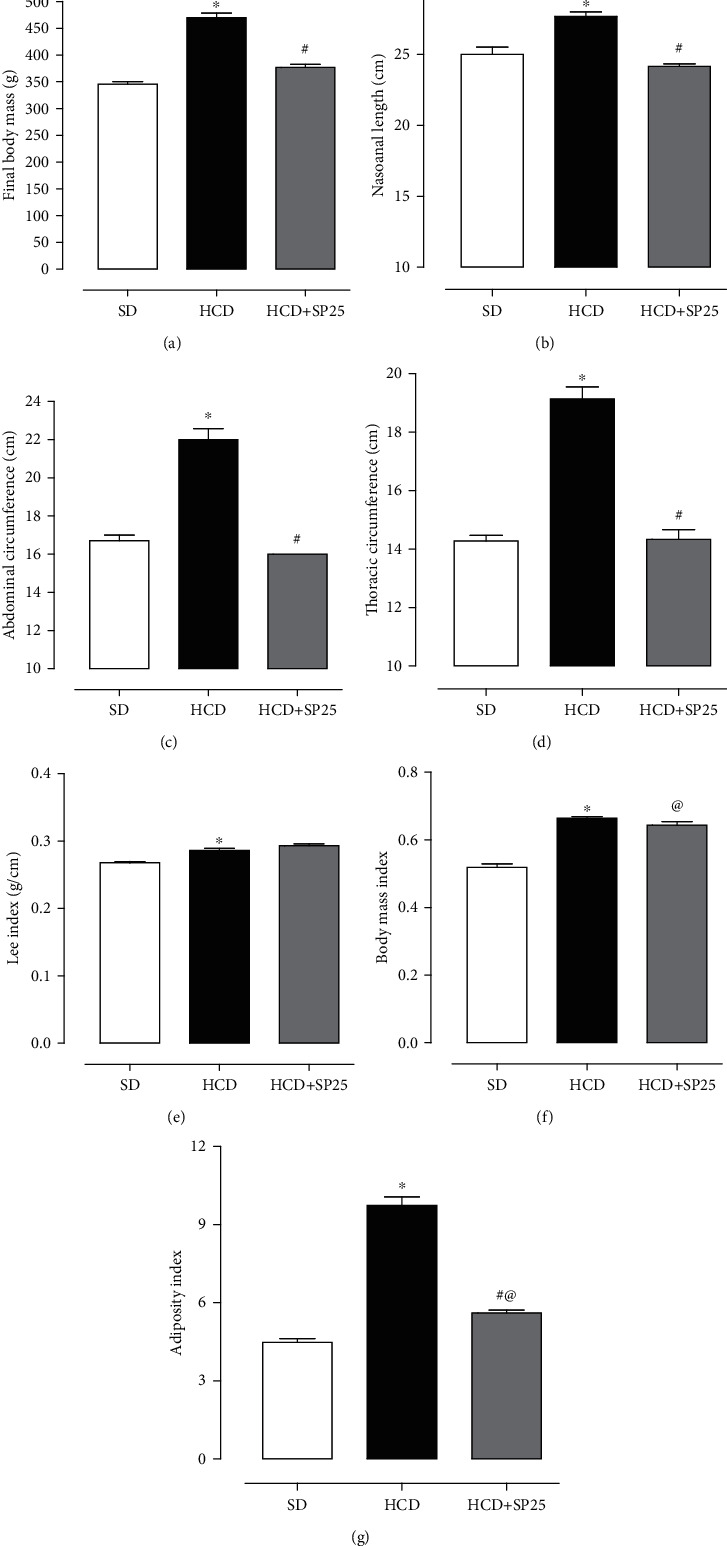
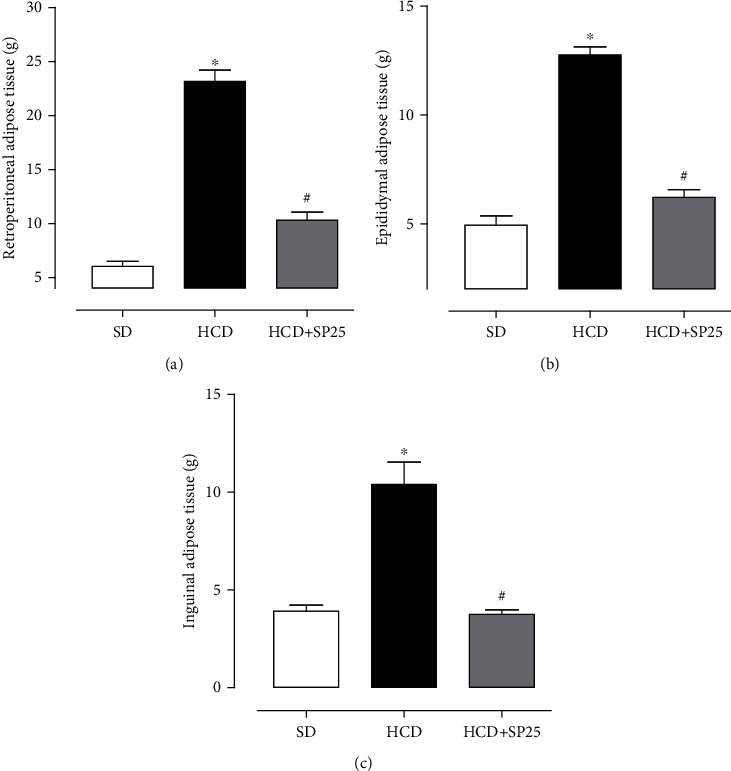
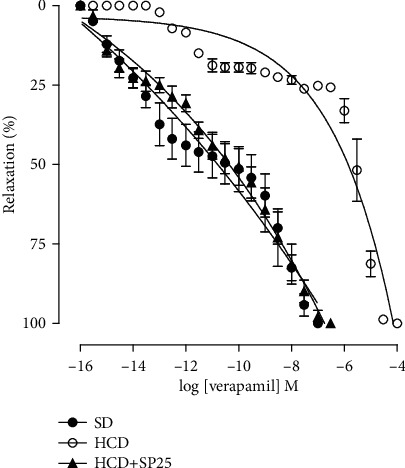
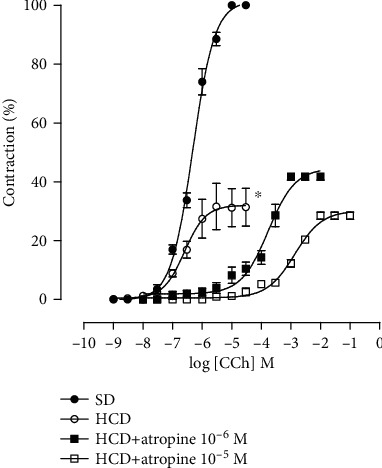
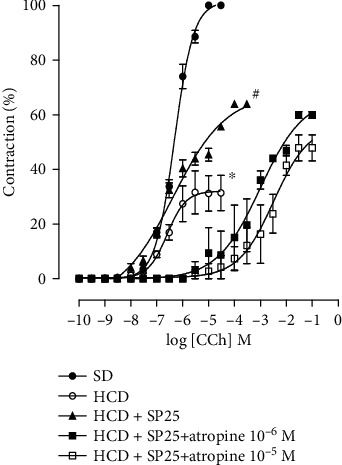
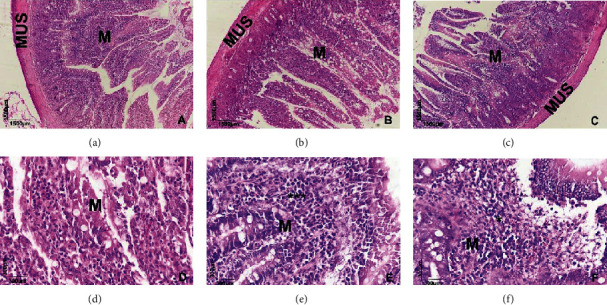
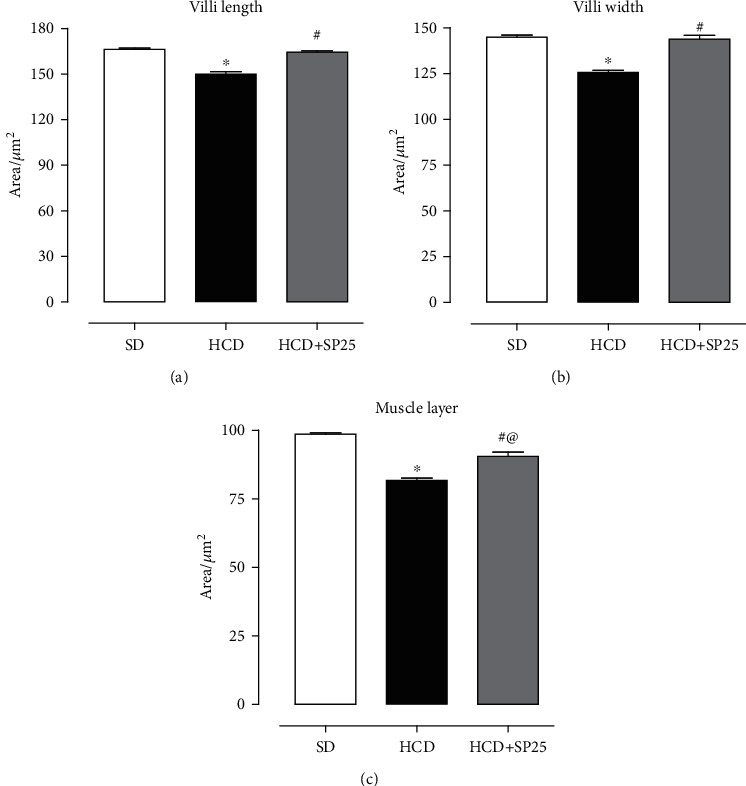
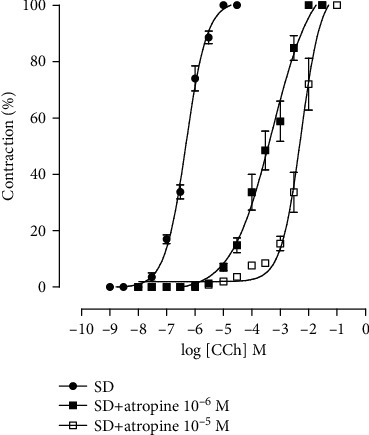
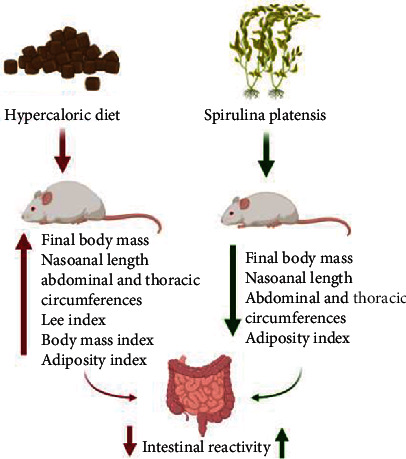
The consumption of hypercaloric diets is related to the development of obesity, favoring the etiology of gastrointestinal disorders. In this context, Spirulina platensis (SP), some blue-green algae with antioxidant action, appears as a potential therapeutic alternative to prevent obesity and associated intestinal disorders. Thus, the present study is aimed at evaluating the deleterious effects of the hypercaloric diet on the contractile and relaxing reactivity of the ileum of rats, as well as the possible preventive mechanisms of dietary supplementation with SP. Wistar rats were divided into three groups: fed a standard diet (SD), a hypercaloric diet (HCD), and/or supplemented with 25 mg/kg SP (HCD + SP25) for 8 weeks. The hypercaloric diet was effective in promoting obesity in rats, as well as decreasing potency and ileal relaxing and contractile efficacy. In contrast, dietary supplementation with SP was able to prevent some of the parameters of experimental obesity. In addition, SP prevented the reduction of intestinal reactivity, possibly due to a positive modulation of voltage-gated calcium channels (CaV) and negative regulation of muscarinic receptors (M3). Thus, food supplementation with Spirulina platensis becomes a promising alternative in the prevention of gastrointestinal diseases induced and/or aggravated by obesity.


Conflict of interest statement

The authors declare no conflict of interest.

Figures

Figure 1
Figure 1
Values of final body mass (a), nasoanal length (b), waist circumference (c), chest circumference (d), Lee index (e), body mass index (f), and adiposity index (g) in rats from group DS, HCD, and HCD + SP25. Columns and vertical bars represent the mean and S.E.M., respectively (n = 5). ANOVA was one-way followed by Tukey's posttest. p < 0.05 (SD vs. HCD); #p < 0.05 (HCD vs. HCD + SP25); @p < 0.05 (SD vs. HCD + SP25). SD: standard diet group supplemented with saline; HCD: hypercaloric diet group supplemented with saline; HCD + SP25: hypercaloric diet group and supplemented with S. platensis at a dose of 25 mg/kg.
Figure 2
Figure 2
Values of the masses of adipose tissue deposits: retroperitoneal (a), epididymal (b), and inguinal (c) in rats from groups SD, HCD, and HCD + SP25. Columns and vertical bars represent the mean and S.E.M., respectively (n = 5). ANOVA was one-way followed by Tukey's posttest. p < 0.05 (SD vs. HCD); #p < 0.05 (HCD vs. HCD + SP25); @p < 0.05 (SD vs. HCD + SP25), (n = 5). SD: standard diet group supplemented with saline; HCD: hypercaloric diet group supplemented with saline; HCD + SP25: hypercaloric diet group and supplemented with S. platensis at a dose of 25 mg/kg.
Figure 3
Figure 3
Cumulative concentration-response curve for verapamil in rat ileum in the SD (●), HCD (○), and HCD + SP25 (▲) groups. The symbols and vertical bars represent the mean and S.E.M., respectively (n = 5). ANOVA was one-way followed by Tukey's posttest. p < 0.05 (SD vs. HCD), #p < 0.05 (HCD vs. HCD + SP25), and @p < 0.05 (SD vs. DHC + SP25). SD: group fed a standard diet; HCD: group fed a hypercaloric diet; HCD + SP25: groups fed a hypercaloric diet and supplemented with S. platensis 25 mg/kg, respectively.
Figure 4
Figure 4
Cumulative concentration-response curves on the CCh of the SD (●), HCD (○), HCD + atropine 10−6 M (■), and HCD + atropine 10−5 M (□) groups in isolated rat ileum. The symbols and vertical bars represent the mean and S.E.M., respectively (n = 5). ANOVA was one-way followed by Tukey's posttest. p < 0.05 (SD vs. HCD), #p < 0.05 (HCD vs. HCD + atropine 10−6 M and 10−5 M), and @p < 0.05 (SD vs. HCD + atropine 10−6 M and 10−5 M). SD: group fed a standard diet; HCD: group fed a hypercaloric diet; HCD + SP25: groups fed a hypercaloric diet and supplemented with S. platensis 25 mg/kg, respectively.
Figure 5
Figure 5
Cumulative concentration-response curves on the CCh of the SD (●), HCD (○), HCD + SP25 (▲), HCD + SP25 + atropine 10−6 M (■), and HCD + SP25 + atropine 10−5 M (□) groups in isolated rat ileum. The symbols and vertical bars represent the mean and S.E.M., respectively (n = 5). ANOVA was one-way followed by Tukey's posttest. p < 0.05 (SD vs. HCD), #p < 0.05 (HCD vs. HCD + SP25), and @p < 0.05 (HCD + SP25 vs. HCD + SP25 + atropine 10−6 M and 10−5 M). SD: group fed a standard diet; HCD: group fed a hypercaloric diet; HCD + SP25: groups fed a hypercaloric diet and supplemented with S. platensis 25 mg/kg, respectively.
Figure 6
Figure 6
Histological section of rat ileum stained in hematoxylin and eosin showing parts of the organ, highlighting the mucosa (M) and the external muscle (MUS). Panoramic view (a–c) and higher magnification (d–f) showing histological images of the ileum of rats from SD, HCD, and HCD + SP25 groups, respectively.
Figure 7
Figure 7
Ileum morphometry showing villi length (a), villi width (b), and muscle layer (c) of groups the SD, HCD, and HCD + SP25. Columns and vertical bars represent the mean and S.E.M., respectively (n = 5). ANOVA was one-way followed by Tukey's posttest. p < 0.05 (SD vs. HCD), #p < 0.05 (HCD vs. HCD + SP25), and @p < 0.05 (HCD + SP25 vs. HCD + SP25). SD: group fed a standard diet; HCD: group fed a hypercaloric diet; HCD + SP25: groups fed a hypercaloric diet and supplemented with S. platensis 25 mg/kg, respectively.
Figure 8
Figure 8
Cumulative concentration-response curves for the CCh of the SD (●), SD + atropine 10−6 M (■), and SD + atropine 10−5 M (□) groups in isolated rat ileum. The symbols and vertical bars represent the mean and S.E.M., respectively (n = 5). ANOVA was one-way followed by Tukey's posttest. p < 0.05 (SD vs. HCD), #p < 0.05 (HCD vs. HCD + SP25), and @p < 0.05 (SD vs. HCD + SP25). SD: group fed a standard diet; HCD: group fed a hypercaloric diet; HCD + SP25: groups fed a hypercaloric diet and supplemented with S. platensis 25 mg/kg, respectively.
Figure 9
Figure 9
The consumption of the hypercaloric diet induces the onset of obesity in rats by increasing all parameters evaluated in this study and consequently leads to a decrease in ileal reactivity. Food supplementation with Spirulina platensis prevents the development of obesity and the reduction of contractile reactives and intestinal relaxants.

Similar articles

References

    1. Brennan V. M., Kumanyika S. K., Zambrana R. E. Baltimore (MD): Johns Hopkins University Press; 2014. Introduction: advancing a new conversation about obesity in the underserved. Obesity interventions in underserved communities: evidence and directions.
    1. Nam S. Obesity-related digestive diseases and their pathophysiology. Gut and Liver. 2017;11(3):323–334. doi: 10.5009/gnl15557. - DOI - PMC - PubMed
    1. Razzoli M., Pearson C., Crow S., Bartolomucci A. Stress, overeating, and obesity: insights from human studies and preclinical models. Neuroscience & Bio Behavioral Reviews. 2017;76(Part A):154–162. doi: 10.1016/j.neubiorev.2017.01.026. - DOI - PMC - PubMed
    1. WHO. Health topics–obesity and overweight. WHO; 2020.
    1. Heymsfield S. B., Wadden T. A. Mechanisms, pathophysiology, and management of obesity. New England Journal of Medicine. 2017;376(3):254–266. doi: 10.1056/NEJMra1514009. - DOI - PubMed

Supplementary concepts