. 2021 Jul 29:2021:5428364.
doi: 10.1155/2021/5428364. eCollection 2021.

Enhanced Sensitivity of Nonsmall Cell Lung Cancer with Acquired Resistance to Epidermal Growth Factor Receptor-Tyrosine Kinase Inhibitors to Phenformin: The Roles of a Metabolic Shift to Oxidative Phosphorylation and Redox Balance

Affiliations

Enhanced Sensitivity of Nonsmall Cell Lung Cancer with Acquired Resistance to Epidermal Growth Factor Receptor-Tyrosine Kinase Inhibitors to Phenformin: The Roles of a Metabolic Shift to Oxidative Phosphorylation and Redox Balance

Suntae Kim et al. Oxid Med Cell Longev. .

Abstract

Background: Although the efficacy of epidermal growth factor receptor-tyrosine kinase inhibitor (EGFR- TKI) therapy has been proven in non-small cell lung cancer (NSCLC) patients, acquired resistance to EGFR-TKIs presents a serious clinical problem. Hence, the identification of new therapeutic strategy is needed to treat EGFR-TKI-resistant NSCLC.

Methods: Acquired EGFR-TKI-resistant lung cancer cell lines (HCC827, H1993, and H292 cells with acquired resistance to gefitinib or erlotinib) were used for cell-based studies. IncuCyte live cell analysis system and XFp analyzer were used for the determination of cell proliferation and energy metabolism, respectively. In vivo anticancer effect of phenformin was assessed in xenografts implanting HCC827 and gefitinib-resistant HCC827 (HCC827 GR) cells.

Results: HCC827 GR and erlotinib-resistant H1993 (H1993 ER) cells exhibited different metabolic properties compared with their respective parental cells, HCC827, and H1993. In EGFR-TKI-resistant NSCLC cells, glycolysis markers including the glucose consumption rate, intracellular lactate level, and extracellular acidification rate were decreased; however, mitochondrial oxidative phosphorylation (OXPHOS) markers including mitochondria-driven ATP production, mitochondrial membrane potential, and maximal OXPHOS capacity were increased. Cell proliferation and tumor growth were strongly inhibited by biguanide phenformin via targeting of mitochondrial OXPHOS complex 1 in EGFR-TKI-resistant NSCLC cells. Inhibition of OXPHOS resulted in a reduced NAD+/NADH ratio and intracellular aspartate levels. Recovery of glycolysis by hexokinase 2 overexpression in erlotinib-resistant H292 (H292 ER) cells significantly reduced the anticancer effects of phenformin.

Conclusion: Long-term treatment with EGFR-TKIs causes reactivation of mitochondrial metabolism, resulting in vulnerability to OXPHOS inhibitor such as phenformin. We propose a new therapeutic option for NSCLC with acquired EGFR-TKI resistance that focuses on cancer metabolism.


Conflict of interest statement

The authors declare that they have no competing interests.

Figures
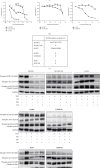
Figure 1
Figure 1
Acquisition of EGFR-TKI resistance by long-term treatment of gefitinib or erlotinib in NSCLCs. (a and b) Effects of EGFR TKIs on cell proliferation of EGFR TKI-resistant lung cancer cells. HCC827, HCC827 GR, H1993, H1993 ER, H292, H292 ER, and H1975 cells were incubated with various concentrations of gefitinib or erlotinib (a) and osimertinib (b), and cell proliferation was monitored for 72 h by IncuCyte ZOOM analyses. Data represent means ± S.E.M. (n = 3 − 6, ∗P < 0.05, ∗∗P < 0.01, ∗∗∗P < 0.001 vs. parental cell line; ###P < 0.001 vs. H1975). (c) Genomic DNA sequencing of EGFR exon 18 to 21. (d) EGFR and its downstream signaling activities in HCC827, HCC827 GR, H1993, H1993 ER, H292, and H292 ER cells. All cells were pretreated with vehicle or 100 nM gefitinib, erlotinib, or osimertinib for 1 h and then exposed to 100 ng/mL EGF for 5 min. Total cell lysates were subjected to immunoblottings for phospho-EGFR (Tyr1068), phosphor-AKT (Ser473), or phosphor-p44/p42 MAPK (Thr202/Tyr204).
Figure 2
Figure 2
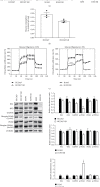
Decreased glycolysis activity in acquired EGFR-TKI-resistant lung cancer. (a) Relative glucose consumption by 2-DG uptake assay. Data represent means ± S.E.M. (n = 3, ∗∗P < 0.01, ∗∗∗P < 0.001 vs. 2-DG uptake in parental cell line). (b) Glucose contents in culture media. Glucose level was determined by GC-MS in culture media from HCC827 and HCC827 GR cells incubated for 24 h. Glucose concentration was normalized by total protein amounts. Data represent means ± S.E.M. (n = 3, ∗P < 0.05 vs. HCC827). (c) ECAR changes. ECAR values were obtained from glycolysis stress test using XFp analyzer. Glucose (10 mM), oligomycin (1 μM), and 2-DG (50 mM) were added at indicated time points. Data represent means ± S.E.M. (n = 3, ∗P < 0.05, ∗∗P < 0.01, ∗∗∗P < 0.001 vs. parental cell line). (d) Basal protein expression levels of glycolysis enzymes. Protein expression of hexokinase (HK)1, HK2, GAPDH, phosphor-PKM2 (Tyr105), PKM2, and phospho-PDHA1 (Ser293) was assessed by immunoblottings.
Figure 3
Figure 3
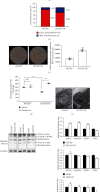
Reactivation of mitochondria function in acquired EGFR-TKI-resistant lung cancer. (a) OCR values were measured by XFp analyzer with cell mito stress kit. Oligomycin (1.5 μM), FCCP (0.5 μM), and mixture of rotenone (Ro, 0.5 μM) and antimycin A (AA, 0.5 μM) were treated at indicated time points. Data represent means ± S.E.M. (n = 3, ∗∗∗P < 0.001 vs. parental cell line). (b) Relative contribution of glycolysis and OXPHOS to ATP production. Using XFp real-time ATP rate assay kit, ATP production rate from glycolysis and OXPHOS was simultaneously determined in HCC827 and HCC827 GR cells. Data represent means (n = 3, ∗P < 0.05 vs. mito ATP production rate in HCC827). (c) Mitochondrial membrane potential. HCC827 and HCC827 GR cells were incubated with 100 nM TMRM for 30 min, and fluorescence signals were detected by IncuCyte ZOOM. Total integrated intensity of TMRM (red fluorescence) was normalized with cell confluence (outlined with yellow line). Data represent means ± S.E.M. (n = 3, ∗∗∗P < 0.001 vs. HCC827). (d) Intracellular lactate levels. HCC827 and HCC827 GR cells were treated with 100 μM phenformin for 24 h, and lactate levels in cell lysates were determined by LC-MS/MS. Intracellular lactate level was normalized with total protein amounts. Data represent means ± S.E.M. (n = 3, ∗∗P < 0.01, ∗∗∗P < 0.001 significant difference between the two indicated groups). (e) Number and size of mitochondria (red arrows) in HCC827 and HCC827 GR cells were analyzed by TEM. (f) Protein level of OXPHOS subunits (ATP5A, UQCRC2, SDHB, COX II, and NDUFB8) was detected by immunoblotting.
Figure 4
Figure 4
Selective anticancer effect of phenformin in acquired EGFR-TKI-resistant lung cancer. (a) HCC827, HCC827 GR, H1993, and H1993 ER cells were exposed to phenformin (30 and 100 μM) for 72 h, and cell proliferation was monitored by IncuCyte ZOOM. Data represent means ± S.E.M. (n = 6, ∗∗∗P < 0.001 vs. parental cell line). (b) Intracellular aspartate level. HCC827 and HCC827 GR cells were treated with 100 μM phenformin for 24 h, and aspartate levels in cell lysates were determined by LC-MS/MS. Data represent means ± S.E.M. (n = 3, ∗∗∗P < 0.001 vs. vehicle-treated group). (c) Potentiation of redox stress by phenformin in acquired EGFR-TKI-resistant cancer cells. Intracellular NAD+/NADH ratio was analyzed in HCC827 and HCC827 GR cells 24 h after exposure with vehicle or 100 μM phenformin. Data represent means ± S.E.M. (n = 3, ∗∗∗P < 0.001 vs. vehicle-treated group). (d) Reversal of antiproliferative effect of phenformin by electron acceptor or aspartate. Cell proliferation was monitored for 72 h in HCC827 and HCC827 GR cells treated with phenformin (30 and 100 μM) in the presence or absence of 1 mM AKB or 10 mM aspartate. Data represent means ± S.E.M. (n = 6, ∗∗P < 0.01, ∗∗∗P < 0.001 vs. vehicle-treated group). (e and f) In vivo anticancer effect of phenformin on tumor growth of EGFR-TKI-resistant lung cancer. HCC827 and HCC827 GR cells were inoculated into right flank of Balb/c nude mice, and the mice were orally administered with 300 mg/kg phenformin or tap water (vehicle) once a day. (e) Representative images. (f) Tumor volumes were measured every other day. Data represent means ± S.E.M. (n = 6 − 10, ∗P < 0.05 vs. vehicle-treated group).
Figure 5
Figure 5
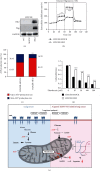
Reversal of antiproliferation effect of phenformin by glycolysis reactivation. (a) Establishment of hexokinase2 overexpressing H292 ER cells (H292 ER-HK2). H292 ER cells were transfected with pCAG-Flag-HK2-IRES-Blas or pCAG-Flag-IRES-Blas and protein expression was confirmed by immunoblotting. (b) ECAR values in H292 ER-MOCK and H292 ER-HK2 cells. Glycolysis stress test was performed by XFp analyzer, and ECAR was measured and normalized with basal ECAR level. Data represent means ± S.E.M. (n = 3, ∗∗P < 0.01, ∗∗∗P < 0.001 vs. H292 ER-MOCK). (c) Relative contribution of glycolysis and OXPHOS to ATP production in H292 ER-MOCK and H292 ER-HK2 cells. Using XFp real-time ATP rate assay kit, ATP production rate from glycolysis and OXPHOS was measured in H292 ER-MOCK and H292 ER-HK2 cells. Data represent means (n = 3, ∗∗P < 0.01 vs. mito ATP production rate in H292 ER-MOCK). (d) Alleviated antiproliferative effect of phenformin by HK2 overexpression. H292 ER-MOCK and H292 ER-HK2 cells were treated with vehicle or phenformin and cell proliferation rate was monitored for 72 h by IncuCyte ZOOM. Data represent means ± S.E.M. (n = 6, ∗∗∗P < 0.001 vs. H292 ER-MOCK). (e) Schematic illustration for metabolic shift to OXPHOS and the enhanced biguanide responsiveness in acquired EGFR-TKI resistant lung cancer.

References

    1. Recondo G., Facchinetti F., Olaussen K. A., Besse B., Friboulet L. Making the first move in _EGFR_ -driven or _ALK_ -driven NSCLC: first- generation or next-generation TKI? Nature Reviews Clinical Oncology. 2018;15(11):694–708. doi: 10.1038/s41571-018-0081-4. - DOI - PubMed
    1. Yu H. A., Arcila M. E., Rekhtman N., et al. Analysis of tumor specimens at the time of acquired resistance to EGFR-TKI therapy in 155 patients with EGFR-mutant lung cancers. Clinical Cancer Research. 2013;19(8):2240–2247. doi: 10.1158/1078-0432.Ccr-12-2246. - DOI - PMC - PubMed
    1. FDA resources for Information. Food and Drug Administration Web site. 2018, https://www.accessdata.fda.gov/drugsatfda_docs/label/2018/208065s008lbl.pdf.
    1. DeBerardinis R. J., Chandel N. S. Fundamentals of cancer metabolism. Science Advances. 2016;2(5, article e1600200) doi: 10.1126/sciadv.1600200. - DOI - PMC - PubMed
    1. Ashton T. M., McKenna W. G., Kunz-Schughart L. A., Higgins G. S. Oxidative phosphorylation as an emerging target in cancer therapy. Clinical Cancer Research. 2018;24(11):2482–2490. doi: 10.1158/1078-0432.Ccr-17-3070. - DOI - PubMed

MeSH terms