

Higher growth variability and stronger responses to temperature changes in wild than hatchery-reared sea trout (Salmo trutta L.)
- PMID: 34367570
- PMCID: PMC8328422
- DOI: 10.1002/ece3.7827
Higher growth variability and stronger responses to temperature changes in wild than hatchery-reared sea trout (Salmo trutta L.)
Abstract
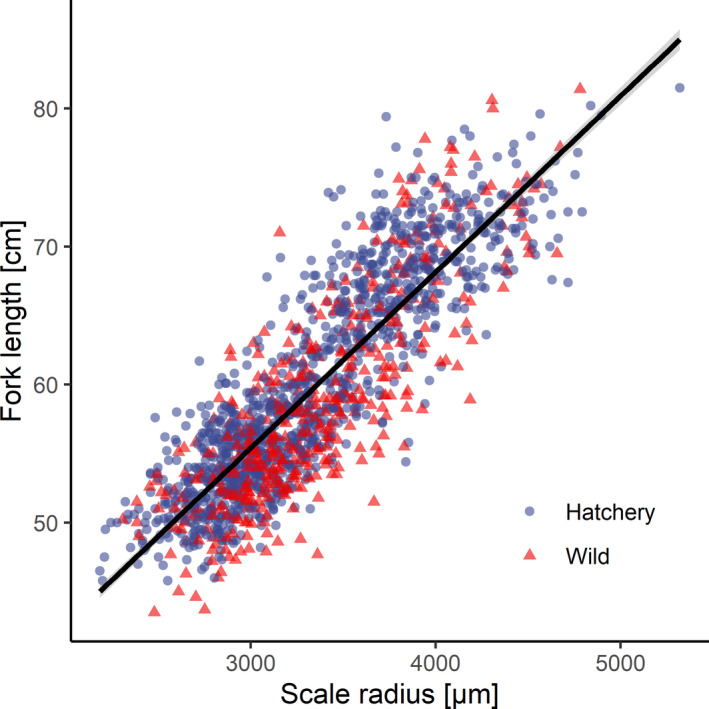
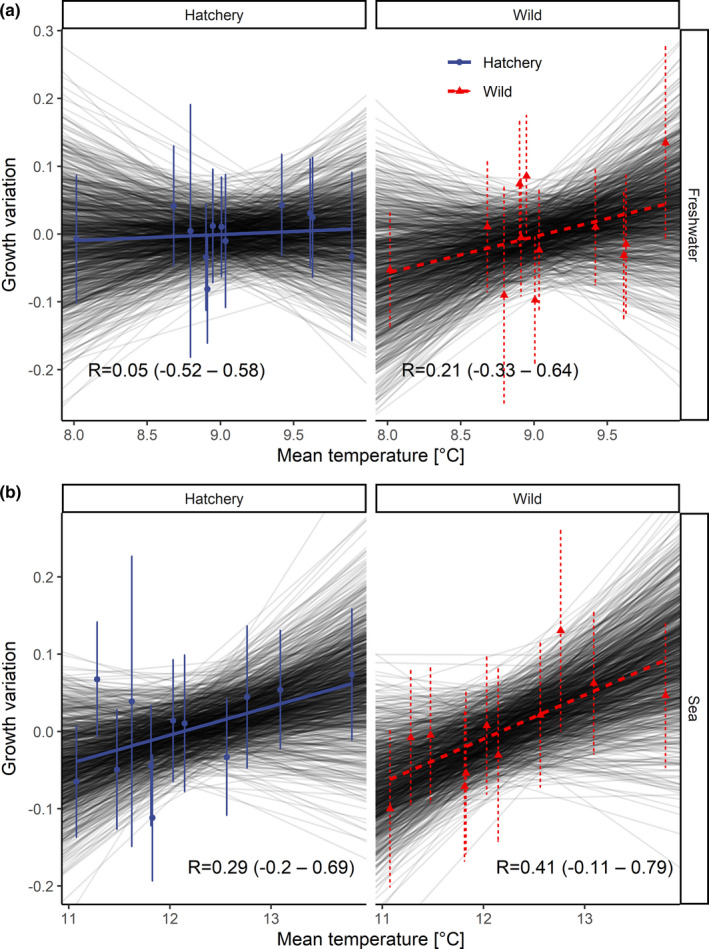
Each year, millions of hatchery-reared sea-run brown trout Salmo trutta L. (the sea trout) juveniles are released into the natural environment in the Atlantic region. The aim of this work was to investigate the growth responses of sea trout to changing temperature conditions and to compare the growth plasticity between wild and hatchery-reared fish. Scales were collected from sea trout in a selected river flowing into the southern Baltic Sea. We analyzed the scale increment widths as a proxy of somatic growth and investigated the interannual variabilities and differences in growth between fish groups (wild and hatchery-reared). We used mixed-effects Bayesian modeling and ascribed the variances in growth to different sources. Furthermore, we developed indices of interannual (2003-2015) growth variation in the marine and freshwater phases of the life cycle of the fish and analyzed the relationships between trout growth and temperature. Temperature positively affects fish growth, regardless of the origin of the fish. We observed stronger relationships between fish growth and temperature conditions in the marine phase than in the freshwater phase. Additionally, wild sea trout are characterized by stronger responses to temperature variability and higher phenotypic plasticity of growth than those of the hatchery-reared individuals. Therefore, wild sea trout might be better suited to changing environmental conditions than hatchery-reared sea trout. This knowledge identifies possible threats in management actions for sea trout with an emphasis on ongoing climate change.
Keywords: Baltic Sea; Bayesian mixed‐effects models; anadromous brown trout; fish; fish scales; sclerochronology.
© 2021 The Authors. Ecology and Evolution published by John Wiley & Sons Ltd.
Conflict of interest statement
The authors have no conflicts of interest to declare.
Figures


References
-
- Aprahamian, M. W. , Smith, K. M. , McGinnity, P. , McKelvey, S. , & Taylor, J. (2003). Restocking of salmonids ‐ opportunities and limitations. Fisheries Research, 62, 11–227. 10.1016/S0165-7836(02)00163-7 - DOI
-
- Araki, H. , & Schmid, C. (2010). Is hatchery stocking a help or harm? Evidence, limitations and future directions in ecological and genetic surveys. Aquaculture, 308, S2–S11. 10.1016/j.aquaculture.2010.05.036 - DOI
-
- Bartel, R. (2001). Return of salmon back to Polish waters. Ecohydrology & Hydrobiology, 1, 377–392.
-
- Bartel, R. , Ikonen, E. , & Auvinen, H. (2001). Differences in migration pattern and growth of Polish and Finnish sea trout (Salmo trutta L.) released in the same areas. Archives of Polish Fisheries, 9, 105–122.
Associated data
LinkOut - more resources
Full Text Sources
Other Literature Sources
