. 2021 Jun 29;5(4):306-314.
doi: 10.1002/evl3.243. eCollection 2021 Aug.

Larger cells have relatively smaller nuclei across the Tree of Life

Affiliations

Larger cells have relatively smaller nuclei across the Tree of Life

Martino E Malerba et al. Evol Lett. .

Abstract

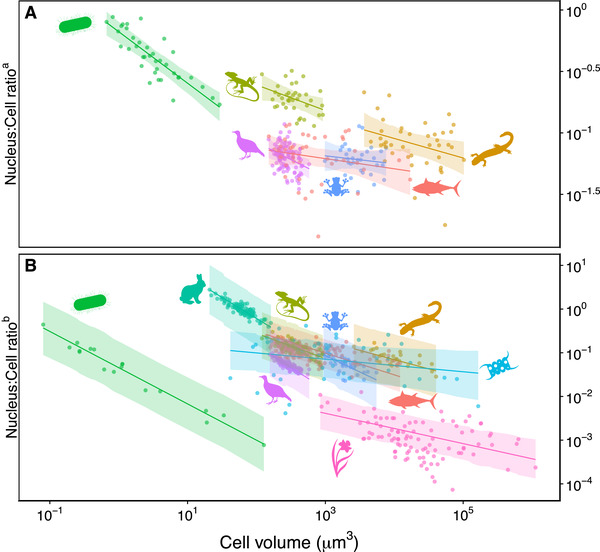
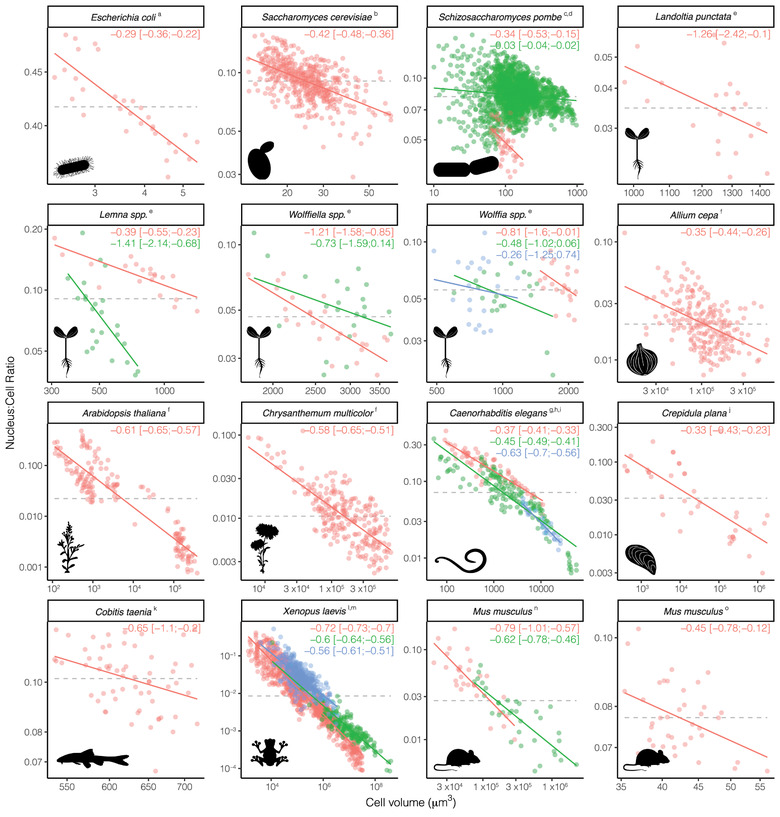
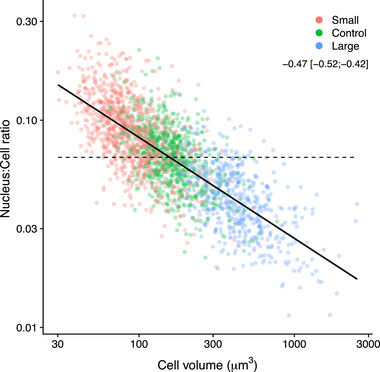
Larger cells have larger nuclei, but the precise relationship between cell size and nucleus size remains unclear, and the evolutionary forces that shape this relationship are debated. We compiled data for almost 900 species - from yeast to mammals - at three scales of biological organisation: among-species, within-species, and among-lineages of a species that was artificially selected for cell size. At all scales, we showed that the ratio of nucleus size to cell size (the 'N: C' ratio) decreased systematically in larger cells. Size evolution appears more constrained in nuclei than cells: cell size spans across six orders of magnitude, whereas nucleus size varies by only three. The next important challenge is to determine the drivers of this apparently ubiquitous relationship in N:C ratios across such a diverse array of organisms.

Keywords: Artificial selection; C‐value enigma; genome size evolution; karyoplasmic ratio; limiting pool hypothesis; nucleoskeletal theory; nucleotypic theory; optimal DNA theory; selfish DNA hypothesis.


Figures

Figure 1
Figure 1
Among‐species comparisons of nucleus volume to cell volume ratio as a function of cell volume (all axes are log10‐transformed). Each dot represents a species, color‐coded for taxonomic clade: nucleoids of prokaryotes, and nuclei of phytoplankton, angiosperms, birds, amphibians (divided between frogs and salamanders), reptiles, fish, and mammals. Continues lines represent the clade‐specific model predictions following the phylogenetic‐controlled model (±95% C.I.). (A) Nucleus:Cell ratio a represents values where nucleus volumes were measured directly. See Fig. S2 for silhouette labels and individual plots and Fig. S5 for formal analysis of the allometric scaling relationships between nucleus volume and cell volume. (B) Nucleus:Cell ratio b represents values where nucleus volume was inferred from DNA content using the model in Fig. S1. See Fig. S6 for silhouette labels and individual plots, and Fig. S7 for formal analysis of the allometric scaling relationship between nucleus volume and cell volume. All slope coefficients are summarised in Fig. S3 (red symbols for Nucleus:Cell ratio a and blue symbols for Nucleus:Cell ratio b).
Figure 2
Figure 2
Within‐species comparison of nucleus volume to cell volume ratio and cell volume (all axes are log10‐transformed). Colors within each panel differentiate among different species within the same genus or among different datasets of the same species. Continues lines represent model fits whose 95% C.I. do not include 0 (i.e. 23 out of 26), with slope coefficients reported in each panel. Grey dashed lines indicate the null hypothesis of a size‐invariant N:C ratio (i.e. slope = 0 and intercept estimated from the data). Allometric slope coefficients were inferred from fitting allometric relationships between nucleus size and cell size in Fig. S8 (see Method section ‘Interpreting trends in N:C ratio across cell size’ for more details). See Fig. S4 for a summary of the slope coefficients. The superscript in the panel title indicates the reference: Gray et al. (2019) a for bacteria; Jorgensen et al. (2007) b, Cantwell and Nurse (2019) c, and Neuman and Nurse (2007) d for yeast; Hoang et al. (2019) e for guard cells of duckweeds; Jovtchev et al. (2006) f for mixed angiosperm leaf cells; Arata et al. (2015) g, Hara et al. (2013) h, and Ladouceur et al. (2015) i for nematode embryos; Conklin (1912) j for mollusc embryos; Maciak et al. (2011) k for fish embryos; Gibeaux et al. (2018) l and and Jevtic et al. (2015) m for amphibian embryos; Jaasma et al. (2006) n for mammal fibroblasts and osteoblastic cells; and Tsichlaki and FitzHarris (2016) ° for mammal embryos.
Figure 3
Figure 3
Nucleus volume to cell volume ratio (N:C ratio) as a function of cell volume among cells of Dunaliella tertiolecta that were artificial selected for size (both axes are log10‐transformed). Each point is a cell after correcting for blocking factor (i.e. generation time) and random covariates (i.e. slope and intercept for the lineage identity, nested within generation). The color of the points represents the size‐selection treatment. Continuous line shows the fit of a linear mixed‐effect model, whose slope coefficient is reported in the legend [±95% C.I.]. Dashed line displays the null hypothesis of a size‐invariant N:C ratio (i.e. slope = 0 and intercept estimated from the data). The allometric slope coefficient was inferred from fitting an allometric regression between nucleus volume and cell volume in Fig. S9 (see Method section ‘Interpreting trends in N:C ratio across cell size’ for more details).

Similar articles

Cited by

References

    1. Arata, Y. , Takagi H., Sako Y., and Sawa H. 2015. Power law relationship between cell cycle duration and cell volume in the early embryonic development of Caenorhabditis elegans. Front. Physiol. 5: 11. - PMC - PubMed
    1. Bates, D. , Mächler M., Bolker B., and Walker S. 2015. Fitting Linear Mixed‐Effects Models Usinglme4. Journal of Statistical Software 67: 1–48.
    1. Beaton, M. J. , and Cavalier‐Smith T. 1999. Eukaryotic non‐coding DNA is functional: evidence from the differential scaling of cryptomonad genomes. Proc. R. Soc. B‐Biol. Sci. 266: 2053–2059. - PMC - PubMed
    1. Brett, M. T. 2004. When is a correlation between non‐independent variables “spurious”? Oikos 105: 647–656.
    1. Cantwell, H. , and Nurse P. 2019. A systematic genetic screen identifies essential factors involved in nuclear size control. PLos Genet. 15: 19. - PMC - PubMed