

Widespread cryptic variation in genetic architecture between the sexes
- PMID: 34367661
- PMCID: PMC8327960
- DOI: 10.1002/evl3.245
Widespread cryptic variation in genetic architecture between the sexes
Abstract
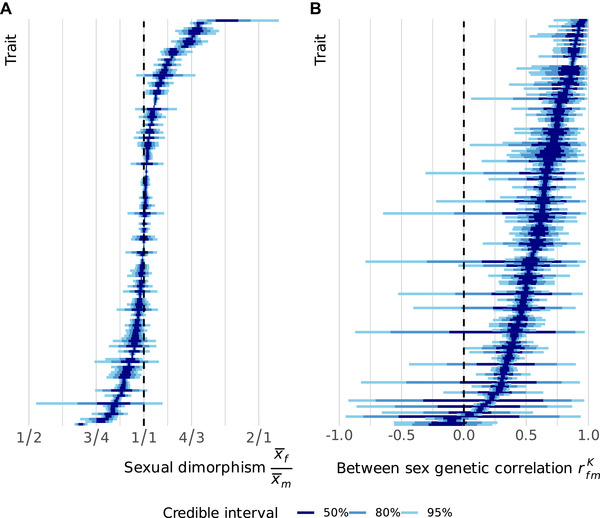
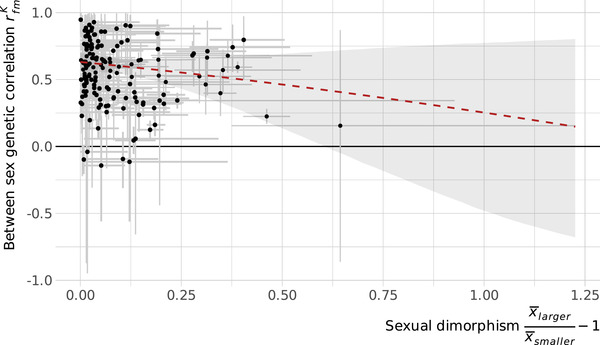
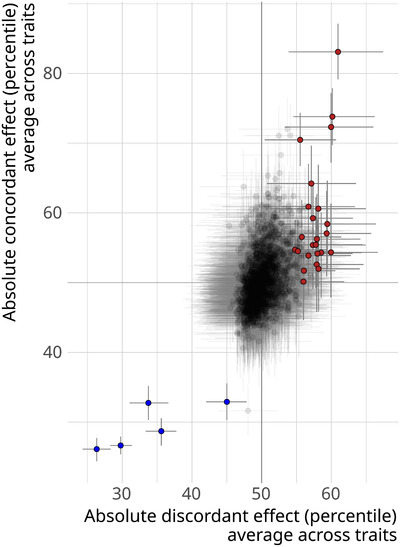
The majority of the genome is shared between the sexes, and it is expected that the genetic architecture of most traits is shared as well. This common architecture has been viewed as a major source of constraint on the evolution of sexual dimorphism (SD). SD is nonetheless common in nature, leading to assumptions that it results from differential regulation of shared genetic architecture. Here, we study the effect of thousands of gene knockout mutations on 202 mouse phenotypes to explore how regulatory variation affects SD. We show that many traits are dimorphic to some extent, and that a surprising proportion of knockouts have sex-specific phenotypic effects. Many traits, regardless whether they are monomorphic or dimorphic, harbor cryptic differences in genetic architecture between the sexes, resulting in sexually discordant phenotypic effects from sexually concordant regulatory changes. This provides an alternative route to dimorphism through sex-specific genetic architecture, rather than differential regulation of shared architecture.
Keywords: Between‐sex genetic correlation; genetic architecture; knockout; rFM; sexual dimorphism.
© 2021 The Authors. Evolution Letters published by Wiley Periodicals LLC on behalf of Society for the Study of Evolution (SSE) and European Society for Evolutionary Biology (ESEB).
Conflict of interest statement
The authors declare no competing interest.
Figures
Similar articles
-
Male bias in distributions of additive genetic, residual, and phenotypic variances of shared traits.Am Nat. 2014 Sep;184(3):326-37. doi: 10.1086/677310. Epub 2014 Aug 6. Am Nat. 2014. PMID: 25141142
-
Sex-specific trait architecture in a spider with sexual size dimorphism.J Evol Biol. 2023 Oct;36(10):1428-1437. doi: 10.1111/jeb.14217. Epub 2023 Sep 13. J Evol Biol. 2023. PMID: 37702091
-
Ontogenetic stage-specific quantitative trait loci contribute to divergence in developmental trajectories of sexually dimorphic fins between medaka populations.Mol Ecol. 2014 Nov;23(21):5258-75. doi: 10.1111/mec.12933. Epub 2014 Oct 13. Mol Ecol. 2014. PMID: 25251151
-
Sexual dimorphism in flowering plants.J Exp Bot. 2013 Jan;64(1):67-82. doi: 10.1093/jxb/ers308. Epub 2012 Nov 25. J Exp Bot. 2013. PMID: 23183260 Review.
-
Sexual dimorphism in phenotypic plasticity and persistence under environmental change: An extension of theory and meta-analysis of current data.Ecol Lett. 2022 Jun;25(6):1550-1565. doi: 10.1111/ele.14005. Epub 2022 Mar 25. Ecol Lett. 2022. PMID: 35334155 Free PMC article. Review.
Cited by
-
On the resolution of sexual conflict over shared traits.Proc Biol Sci. 2024 Jul;291(2027):20240438. doi: 10.1098/rspb.2024.0438. Epub 2024 Jul 31. Proc Biol Sci. 2024. PMID: 39082243 Free PMC article. Review.
-
High rates of evolution preceded shifts to sex-biased gene expression in Leucadendron, the most sexually dimorphic angiosperms.Elife. 2021 Nov 2;10:e67485. doi: 10.7554/eLife.67485. Elife. 2021. PMID: 34726596 Free PMC article.
-
The roles of sexual selection and sexual conflict in shaping patterns of genome and transcriptome variation.Nat Ecol Evol. 2023 Jul;7(7):981-993. doi: 10.1038/s41559-023-02019-7. Epub 2023 Mar 23. Nat Ecol Evol. 2023. PMID: 36959239 Review.
-
Hiding in plain sight: the Y chromosome and its reinvigorated role in evolutionary processes.Evol Lett. 2024 Nov 27;9(2):165-171. doi: 10.1093/evlett/qrae065. eCollection 2025 Apr. Evol Lett. 2024. PMID: 40191417 Free PMC article.
-
The relationship between sexual dimorphism and androgen response element proliferation in primate genomes.Evolution. 2022 Jun;76(6):1331-1346. doi: 10.1111/evo.14483. Epub 2022 Apr 25. Evolution. 2022. Retraction in: Evolution. 2024 Jan 4;78(1):209. doi: 10.1093/evolut/qpad182. PMID: 35420699 Free PMC article. Retracted.
References
-
- Badyaev, A. V. 2002. Growing apart: an ontogenetic perspective on the evolution of sexual size dimorphism. Trends Ecol. Evol. 17:369–378.
-
- Bates, D. , Mächler M., Bolker B., and Walker S.. 2015. Fitting linear mixed‐effects models using lme4. J. Stat. Softw. 67:1–48.
-
- Benjamini, Y. , and Hochberg Y.. 1995. Controlling the false discovery rate: a practical and powerful approach to multiple testing. J. R. Stat. Soc. Ser. B Methodol. 57:289–300.
