. 2021 Jul 21:11:709210.
doi: 10.3389/fonc.2021.709210. eCollection 2021.

Single-Cell Transcriptomics Reveals the Complexity of the Tumor Microenvironment of Treatment-Naive Osteosarcoma

Affiliations

Single-Cell Transcriptomics Reveals the Complexity of the Tumor Microenvironment of Treatment-Naive Osteosarcoma

Yun Liu et al. Front Oncol. .

Erratum in

Abstract

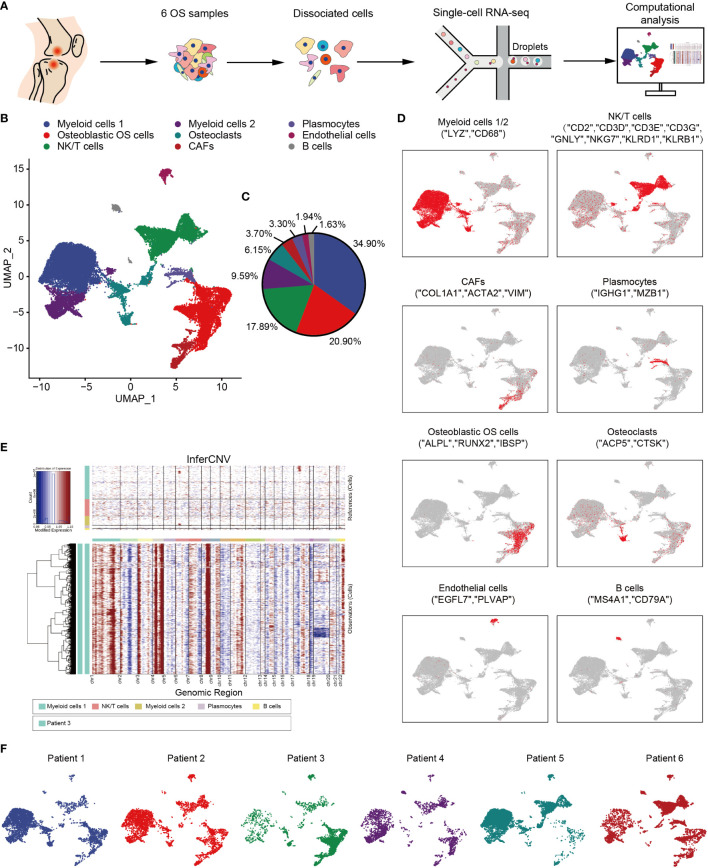
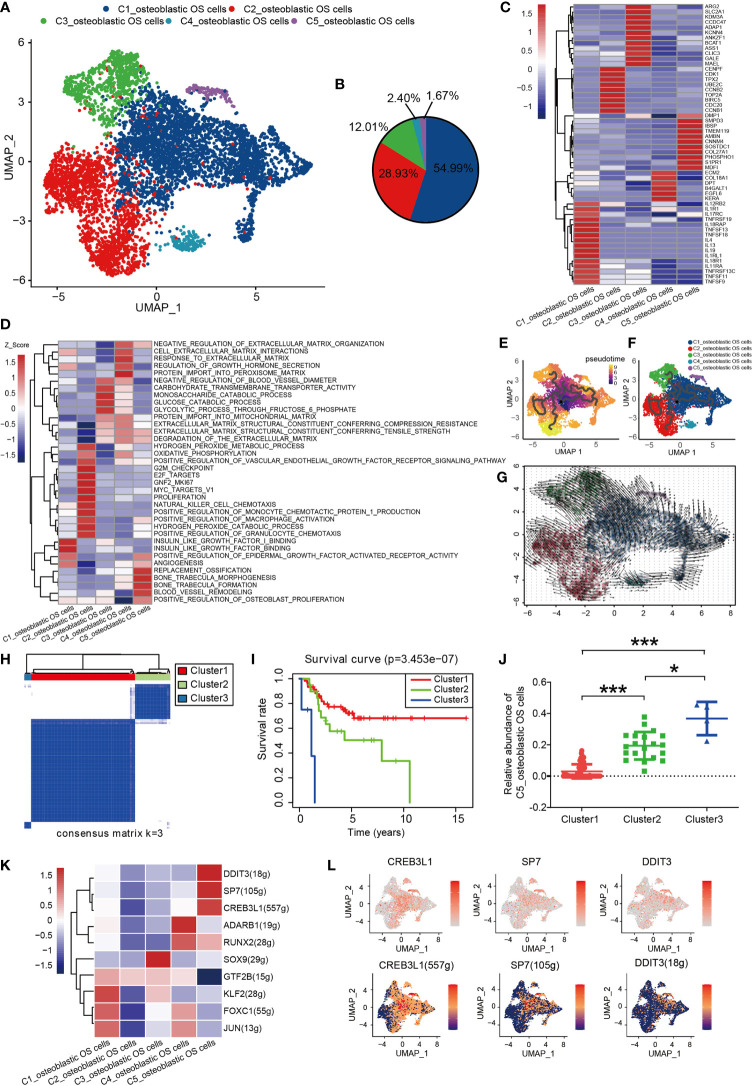
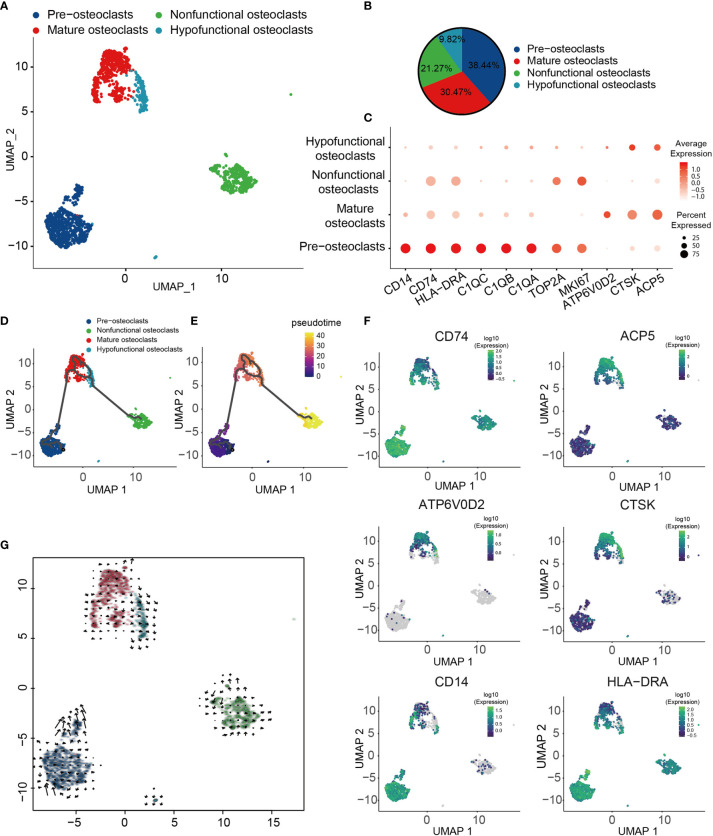
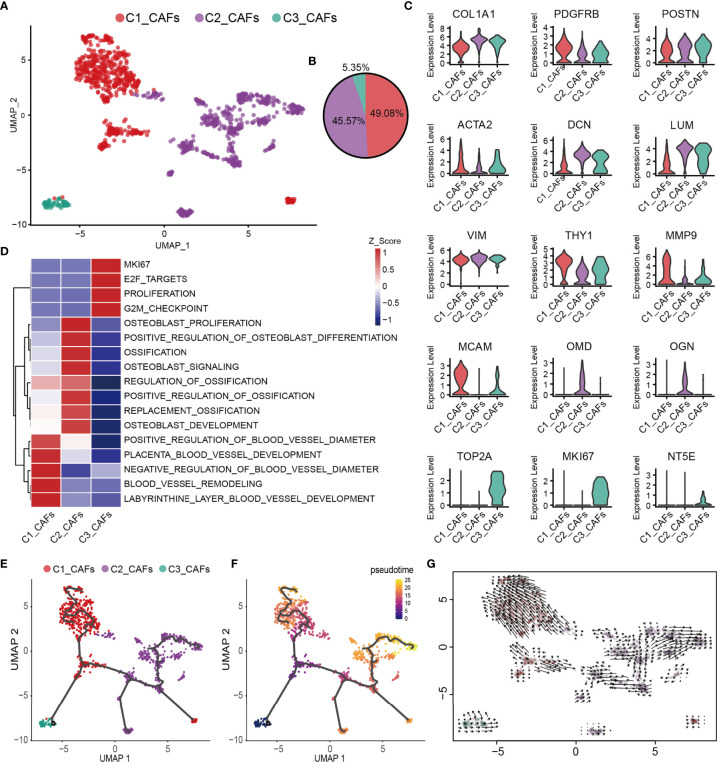
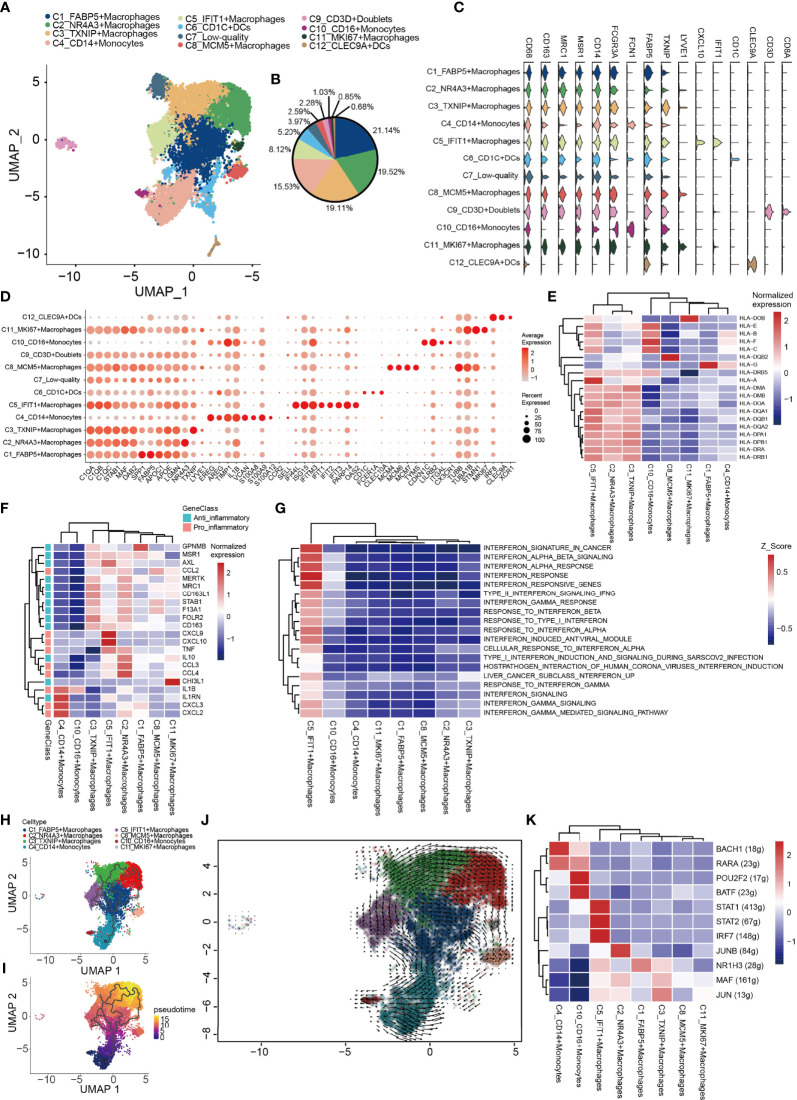
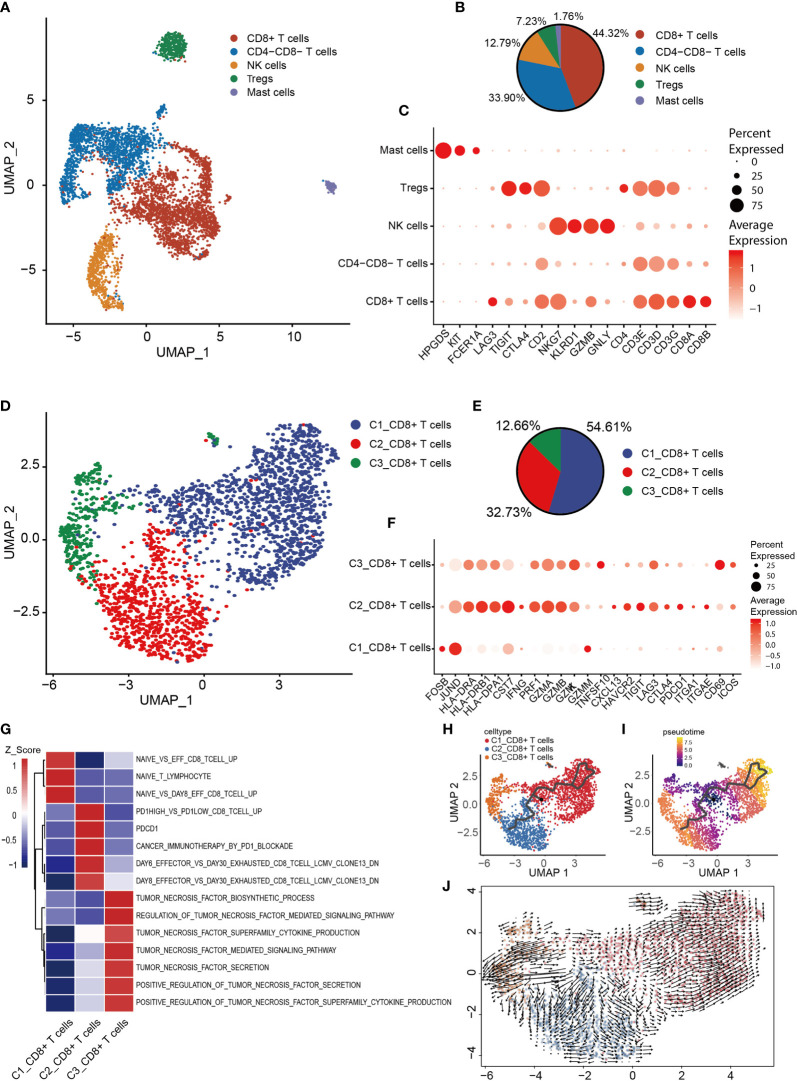
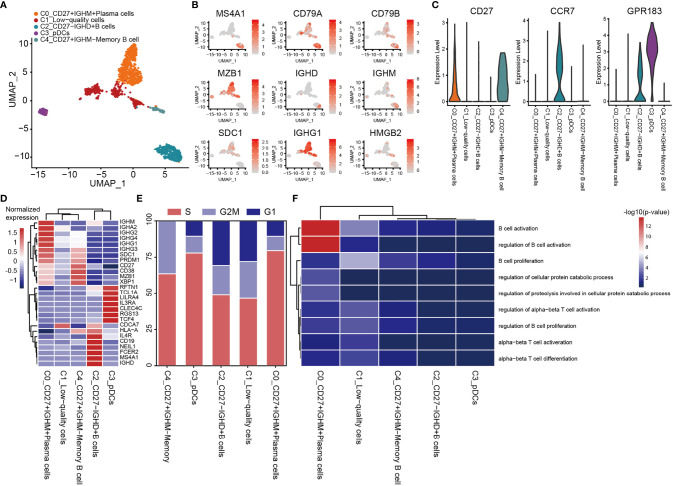
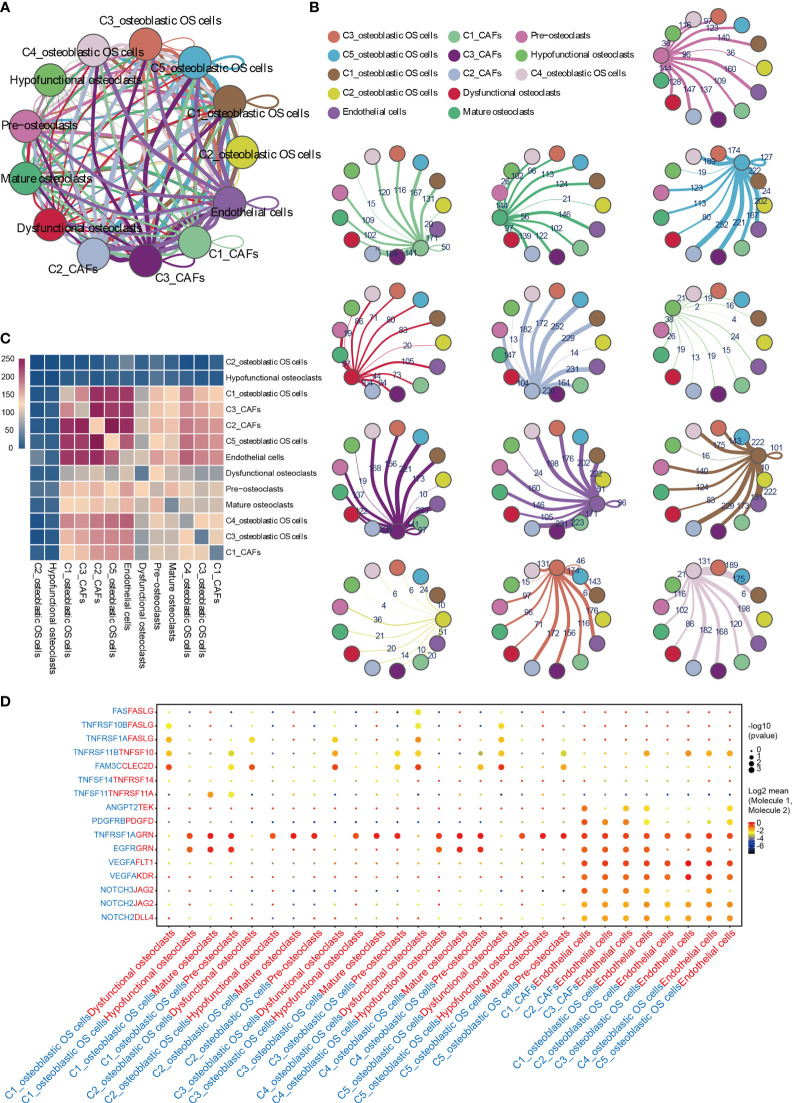
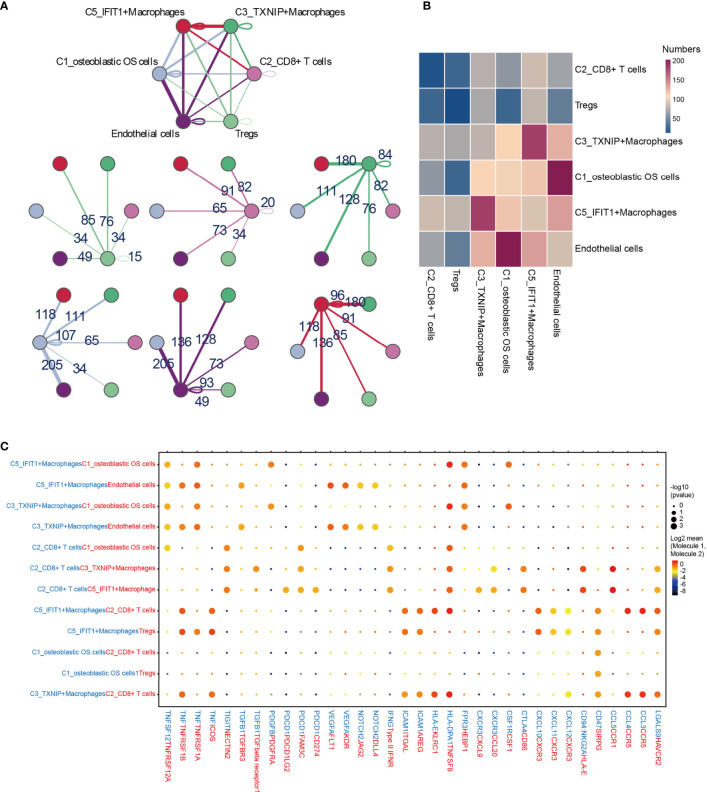
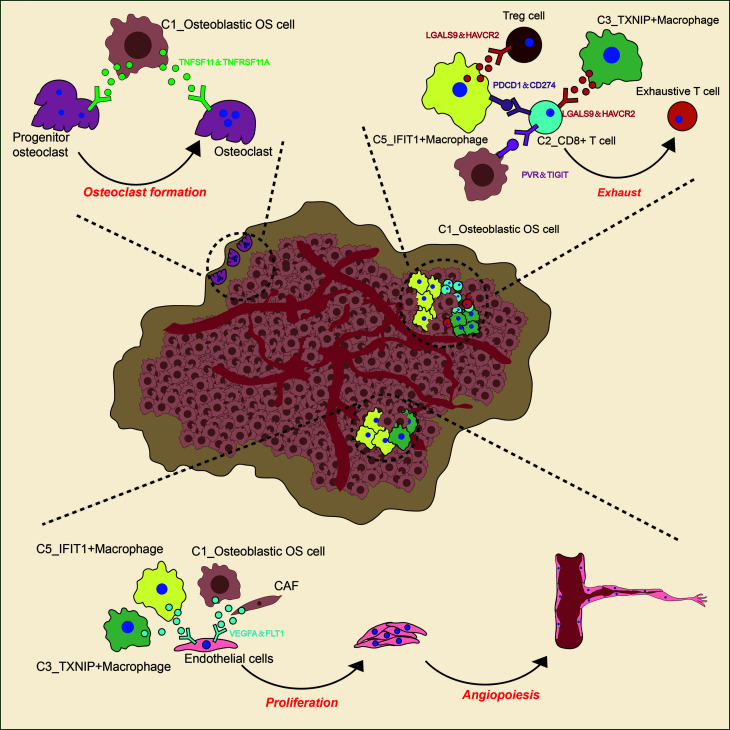
Osteosarcoma (OS), which occurs most commonly in adolescents, is associated with a high degree of malignancy and poor prognosis. In order to develop an accurate treatment for OS, a deeper understanding of its complex tumor microenvironment (TME) is required. In the present study, tissues were isolated from six patients with OS, and then subjected to single-cell RNA sequencing (scRNA-seq) using a 10× Genomics platform. Multiplex immunofluorescence staining was subsequently used to validate the subsets identified by scRNA-seq. ScRNA-seq of six patients with OS was performed prior to neoadjuvant chemotherapy, and data were obtained on 29,278 cells. A total of nine major cell types were identified, and the single-cell transcriptional map of OS was subsequently revealed. Identified osteoblastic OS cells were divided into five subsets, and the subsets of those osteoblastic OS cells with significant prognostic correlation were determined using a deconvolution algorithm. Thereby, different transcription patterns in the cellular subtypes of osteoblastic OS cells were reported, and key transcription factors associated with survival prognosis were identified. Furthermore, the regulation of osteolysis by osteoblastic OS cells via receptor activator of nuclear factor kappa-B ligand was revealed. Furthermore, the role of osteoblastic OS cells in regulating angiogenesis through vascular endothelial growth factor-A was revealed. C3_TXNIP+ macrophages and C5_IFIT1+ macrophages were found to regulate regulatory T cells and participate in CD8+ T cell exhaustion, illustrating the possibility of immunotherapy that could target CD8+ T cells and macrophages. Our findings here show that the role of C1_osteoblastic OS cells in OS is to promote osteolysis and angiogenesis, and this is associated with survival prognosis. In addition, T cell depletion is an important feature of OS. More importantly, the present study provided a valuable resource for the in-depth study of the heterogeneity of the OS TME.

Keywords: heterogeneity; naive osteosarcoma; osteolysis; single-cell RNA sequencing; tumor microenvironment.


Conflict of interest statement

The authors declare that the research was conducted in the absence of any commercial or financial relationships that could be construed as a potential conflict of interest.

Figures

Figure 1
Figure 1
Overview of single cells derived from OS tissues. (A) Workflow depicting collection and processing of specimens of OS tumors for scRNA-seq. (B) UMAP plot of all the single cells, with each color-coded for the 9 major cell types. (C) Pie chart, indicating the cell composition of OS. (D) UMAP plots of the normalized marker expression of the 9 major cell types. (E) The large-scale chromosomal landscape in patient 3 was calculated using reference cells (myeloid cells 1/2, NK/T cells, plasmocytes and B cells); the red color represents an increased copy number, whereas the blue color represents a decreased copy number. (F) UMAP plot of all the single cells, with each cell color-coded for different patients. OS, osteosarcoma; UMAP, uniform manifold approximation and projection; scRNA-seq, single-cell RNA sequencing; NK, natural killer.
Figure 2
Figure 2
Heterogeneity of osteoblastic OS cell populations in OS. (A) UMAP plot showing osteoblastic OS cells. Different cell types are represented by the different colors. (B) Pie chart, indicating the cell composition of osteoblastic OS cells. (C) Heat map showing the marker genes of each cluster, with the selected osteoblastic OS cell marker genes in each cluster highlighted. (D) GSVA, showing the function of different types of osteoblastic OS cells. (E, F) Differentiation and developmental trajectories of osteoblastic OS cells in OS. (G) RNA velocity field projected onto the UMAP plot of the osteoblastic OS cells; the arrows indicate the direction of differentiation and the average velocity. (H) OS patients in the TARGET OS cohort were clustered into 3 clusters by ConsensusClusterPlus, based on cell clusters identified in this profile. (I) Kaplan-Meier survival curve of 3 patient clusters. (J) Relative abundance of C5_osteoblastic OS cell Clusters 1 (left), 2 (middle) and 3 (right). (K) Heatmap of the AUC scores of expression regulation by transcription factors estimated by SCENIC. (L) UMAP plot of osteoblastic OS cells, color-coded for the expression level (up) and for the AUC of the estimated regulon activity of these transcription factors (down). *P < 0.05,***P < 0.001; OS, osteosarcoma; UMAP, uniform manifold approximation and projection; GSVA, gene set variation analysis; SCENIC, single-cell regulatory network inference and clustering; AUC, area under the curve.
Figure 3
Figure 3
Heterogeneity of OC populations in human OS. (A) UMAP plot showing OCs, with different cell types represented by different colors. (B) Pie chart, indicating the cell composition of OC. (C) Dot-plot of marker genes in each cell subtype; shades of red represent the expression level, and dot sizes represent relative abundance. (D, E) Differentiation and developmental trajectories of OCs in OS, with different colors representing different cell subtypes. (F) Differentiation and developmental trajectories using marker gene expression (CD74, ACP5, ATP6V0D2, CTSK, CD14 and HLA-DRA). (G) RNA velocity field projected onto the UMAP plot of the OC; arrows indicate the direction of differentiation and the average velocity. OC, osteoclast; OS, osteosarcoma; UMAP, uniform manifold approximation and projection.
Figure 4
Figure 4
Heterogeneity of CAF populations in human OS. (A) UMAP plot showing CAFs, with different cell types represented by the different colors. (B) Pie chart, showing the cell composition of CAFs; different cell types are represented by different colors. (C) Violin plots showing relevant marker genes of CAF subtypes. (D) GSVA, showing the function of C1_CAFs, C2_CAFs and C3_CAFs. (E, F) Differentiation and developmental trajectories of CAFs in OS; different colors represent the different cell subtypes. (G) RNA velocity field projected onto the UMAP plot of the CAFs; arrows indicate the direction of differentiation and the average velocity. CAFs, cancer-associated fibroblasts; OS, osteosarcoma; UMAP, uniform manifold approximation and projection; GSVA, gene set variation analysis.
Figure 5
Figure 5
Heterogeneity of myeloid cells populations in human OS. (A) UMAP plot showing the myeloid cells, with different cell types represented by the different colors. (B) Pie chart showing the cell composition of myeloid cells, with different cell types represented by the different colors. (C) Violin plots showing relevant marker genes of the myeloid cell subtypes. (D) Dot-plot of marker genes in each cell subtype; shades of red represent the expression level, and dot sizes represent the relative abundance. (E) Heat map showing the encoding major histocompatibility complex class I and II molecules of the genes of each macrophage subtype. (F) Heat map showing the anti-inflammatory and pro-inflammatory genes of each macrophage subtypes. (G) GSVA showing the interferon-related functions of each macrophage subtype. (H, I) Differentiation and developmental trajectories of different cell subtypes in macrophages. (J) RNA velocity field projected onto the UMAP plot of the macrophages; arrows indicate the direction of differentiation and the average velocity. (K) Heat map of the AUC scores of expression regulation by transcription factors estimated by SCENIC. OS, osteosarcoma; UMAP, uniform manifold approximation and projection; GSVA, gene set variation analysis; SCENIC, single-cell regulatory network inference and clustering; AUC, area under the curve.
Figure 6
Figure 6
Heterogeneity of NK/T cells populations in OS. (A) UMAP plot showing NK/T cells, with different cell types represented by the different colors. (B) Pie chart, showing the cell composition of NK/T cells, with different cell types represented by the different colors. (C) Dot-plot showing the marker genes in each cell subtype of NK/T cells; shades of red represent the expression level, and dot sizes represent the relative abundance. (D) UMAP plot representing CD8+ T cells, with different cell types represented by the different colors. (E) Pie chart showing the cell composition of CD8+ T cells, with different cell types represented by the different colors. (F) Dot-plot showing the marker genes in each cell subtype of CD8+ T cells; shades of red represent the expression level, and dot sizes represent the relative abundance. (G) GSVA, showing the function of the different subtypes of CD8+ T cells. (H, I) Differentiation and developmental trajectories of CD8+ T cells, with different colors representing different cell subtypes. (J) RNA velocity field projected onto the UMAP plot of the CD8+ T cells; arrows indicate the direction of differentiation and average velocity. OS, osteosarcoma; UMAP, uniform manifold approximation and projection; GSVA, gene set variation analysis; NK, natural killer.
Figure 7
Figure 7
Heterogeneity of B cell populations in OS. (A) UMAP plot showing B cells, with different cell types represented by the different colors. (B) Cell types are defined by known genes the red color represents genes expressed, with gray representing no genes expressed. (C) Violin plots, showing relevant marker genes of B cells. (D) Heat map showing the marker genes of each cluster, with the selected B cell marker genes in each cluster highlighted. (E) Fractions of cells for the B cell subclusters are shown, with predicted cell cycle phases. (F) GO analysis, showing the function of subpopulations of B cells. OS, osteosarcoma; UMAP, uniform manifold approximation and projection; GO, gene onotology.
Figure 8
Figure 8
CellPhoneDB analysis of nonimmune cells in the OS. (A) Interaction network constructed by CellPhoneDB. Each line color indicates the ligands expressed by the cell population represented by the same color (labeled). The lines connect to the cell types that express the cognate receptors. The line thickness is proportional to the number of ligands when cognate receptors are present in the recipient cell type. (B) Detailed view of the ligands expressed by each major cell type, and the cells expressing the cognate receptors primed to receive the signal, are shown. Numbers indicate the quantity of ligand-receptor pairs for each intercellular link. (C) Heat map showing the number of potential ligand-receptor pairs among the predicted cell types. (D) Overview of selected ligand-receptor interactions of cells in OS. OS, osteosarcoma; TME, tumor microenvironment.
Figure 9
Figure 9
CellPhoneDB analysis of immune cells in the OS. (A) Interaction network constructed by TXNIP+ macrophages, IFIT1+ macrophages, osteoblastic OS cells, endothelial cells, Tregs and CD8+ T cells 2. (B) Heat map showing the potential ligand-receptor pairs among the predicted cell types. (C) Ligand-receptor pairs with a biological significance are shown in bubble diagrams. OS, osteosarcoma.
Figure 10
Figure 10
Predicted regulatory network, centered on OS.

Similar articles

Cited by

References

    1. Koksal H, Muller E, Inderberg EM, Bruland O, Walchli S. Treating Osteosarcoma With CAR T Cells. Scand J Immunol (2019) 89:e12741. doi: 10.1111/sji.12741 - DOI - PubMed
    1. Kansara M, Teng MW, Smyth MJ, Thomas DM. Translational Biology of Osteosarcoma. Nat Rev Cancer (2014) 14:722–35. doi: 10.1038/nrc3838 - DOI - PubMed
    1. Ritter J, Bielack SS. Osteosarcoma. Ann Oncol (2010) 21 Suppl 7:vii320–5. doi: 10.1093/annonc/mdq276 - DOI - PubMed
    1. Ishii G, Ochiai A, Neri S. Phenotypic and Functional Heterogeneity of Cancer-Associated Fibroblast Within the Tumor Microenvironment. Adv Drug Deliv Rev (2016) 99:186–96. doi: 10.1016/j.addr.2015.07.007 - DOI - PubMed
    1. Binnewies M, Roberts EW, Kersten K, Chan V, Fearon DF, Merad M, et al. . Understanding the Tumor Immune Microenvironment (TIME) for Effective Therapy. Nat Med (2018) 24:541–50. doi: 10.1038/s41591-018-0014-x - DOI - PMC - PubMed