. 2021 Jul 9;24(8):102833.
doi: 10.1016/j.isci.2021.102833. eCollection 2021 Aug 20.

Intercellular cGAMP transmission induces innate immune activation and tissue inflammation in Trex1 deficiency

Affiliations

Intercellular cGAMP transmission induces innate immune activation and tissue inflammation in Trex1 deficiency

Bianca B Jütte et al. iScience. .

Abstract

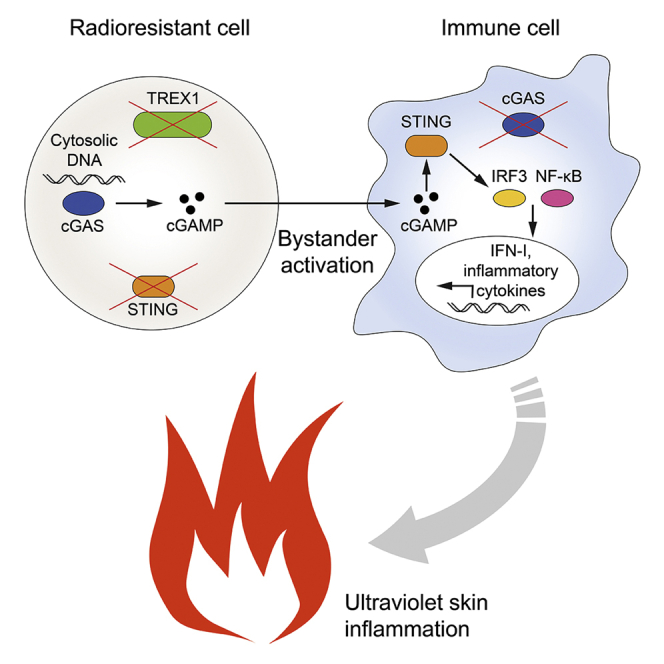
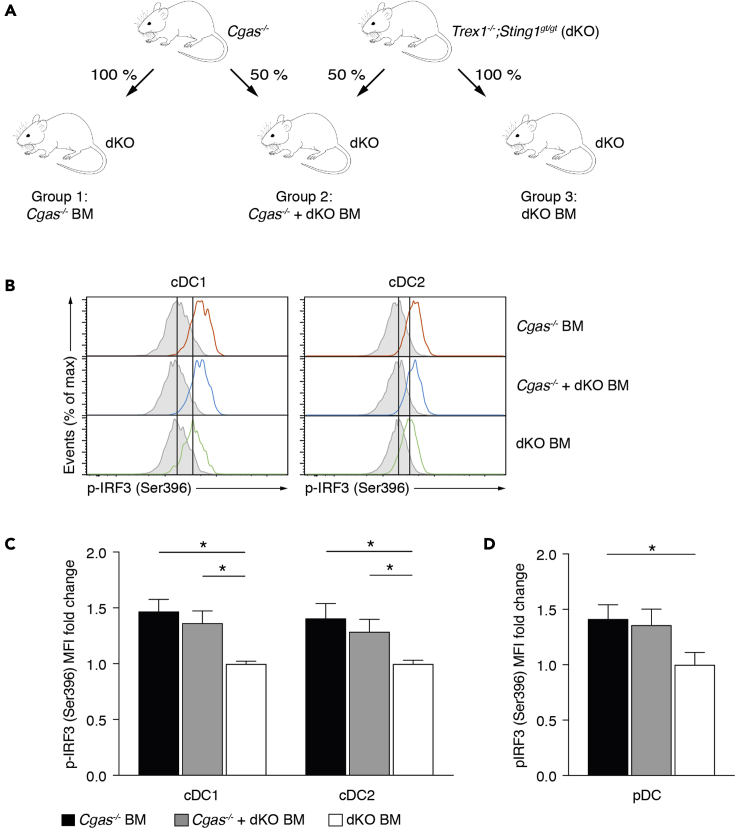
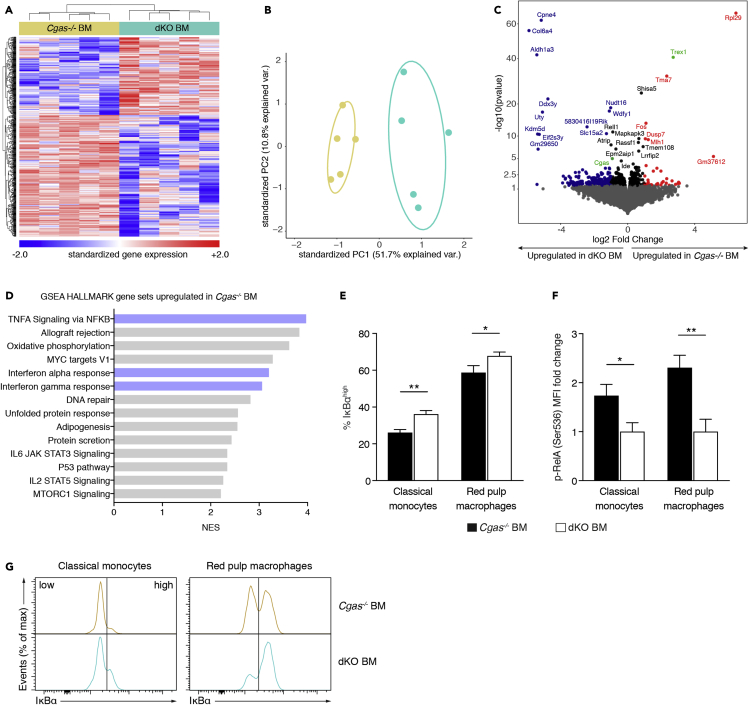
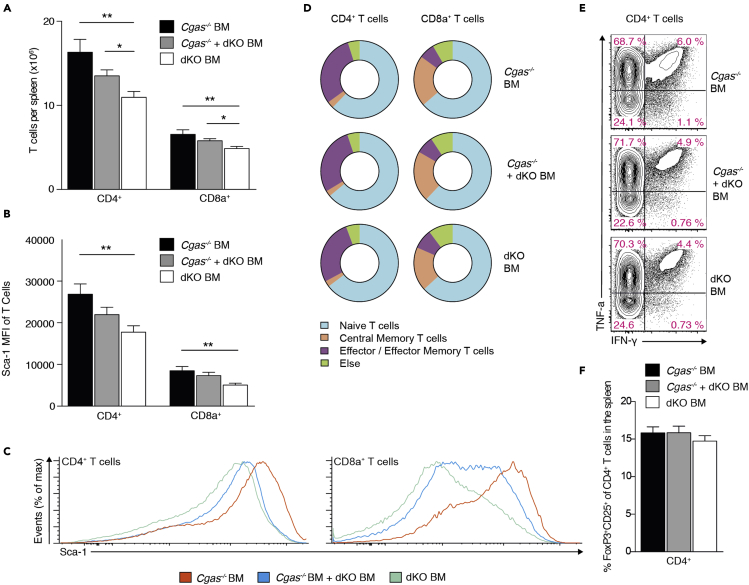
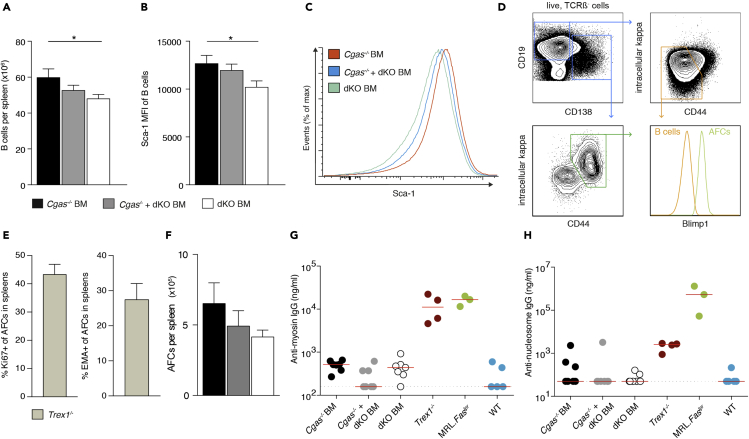
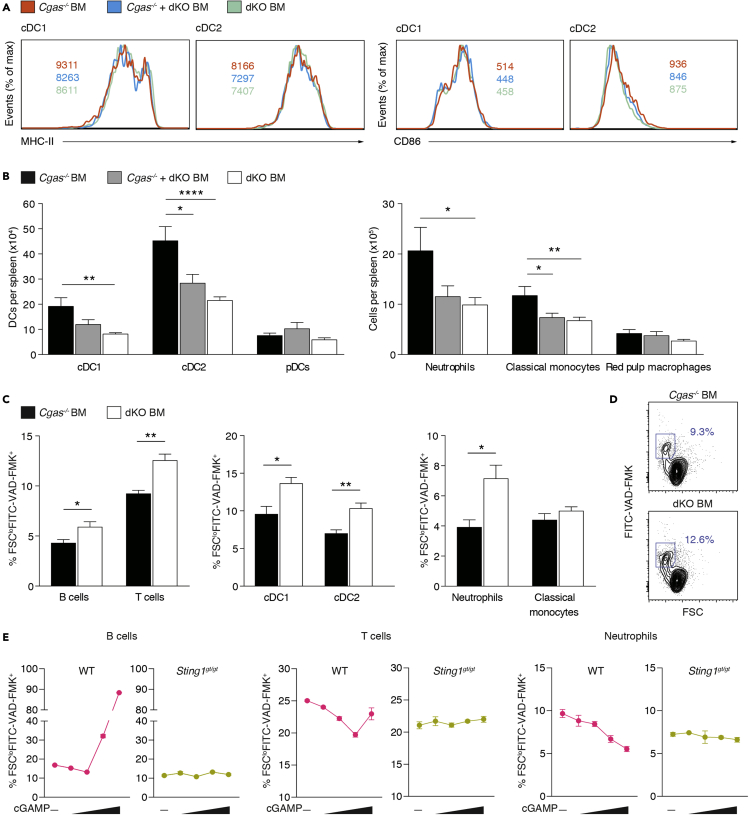
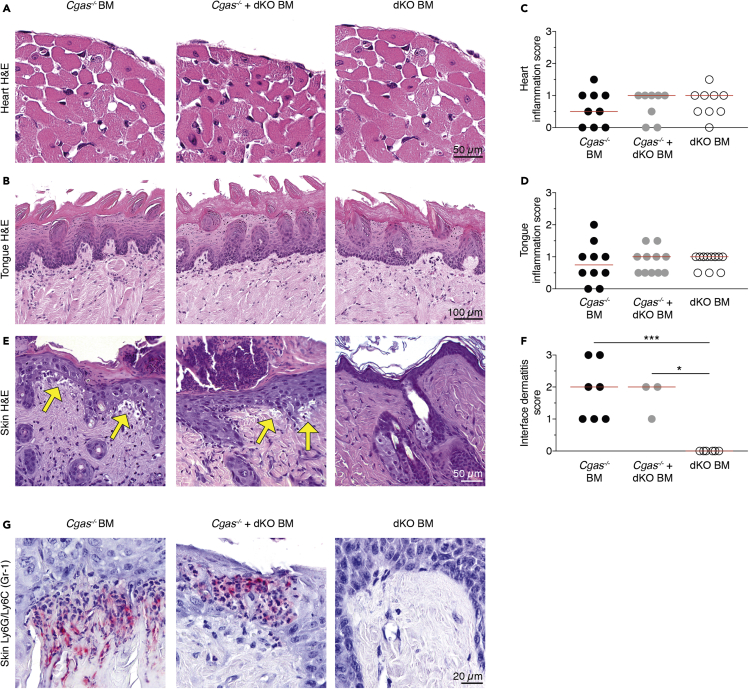
Intercellular transmission of the second messenger 2',3'-cGAMP, synthesized by the viral DNA sensor cGAMP synthase (cGAS), is a potent mode of bystander activation during host defense. However, whether this mechanism also contributes to cGAS-dependent autoimmunity remains unknown. Here, using a murine bone marrow transplantation strategy, we demonstrate that, in Trex1 -/- -associated autoimmunity, cGAMP shuttling from radioresistant to immune cells induces NF-κB activation, interferon regulatory factor 3 (IRF3) phosphorylation, and subsequent interferon signaling. cGAMP travel prevented myeloid cell and lymphocyte death, promoting their accumulation in secondary lymphoid tissue. Nonetheless, it did not stimulate B cell differentiation into autoantibody-producing plasmablasts or aberrant T cell priming. Although cGAMP-mediated bystander activation did not induce spontaneous organ disease, it did trigger interface dermatitis after UV light exposure, similar to cutaneous lupus erythematosus. These findings reveal that, in Trex1-deficiency, intercellular cGAMP transfer propagates cGAS signaling and, under conducive conditions, causes tissue inflammation.

Keywords: Cell biology; Immune response; Immunity; Immunology.


Conflict of interest statement

The authors declare no competing interests.

Figures

None
Graphical abstract
Figure 1
Figure 1
Cell-extrinsic cGAMP activates the IRF3 pathway in DCs (A) Schematic of bone marrow transplantation experiments. Lethally irradiated Trex1−/−;Sting1gt/gt (dKO) mice received bone marrow from Cgas−/- or dKO donor mice for groups 1 and 3, respectively. For group 2, recipients were transplanted with a mixture of bone marrow from both donor types. (B) Spontaneous IRF3 signaling in splenic cDCs. Histograms display representative results for p-IRF3 (Ser396) of gated cDCs in instantly fixed spleens. Each histogram shows an overlay of λ protein phosphatase-treated (gray shaded) and untreated (colored) cells. (C and D) Fold change of p-IRF3 mean fluorescence intensity (MFI) of cDCs (C) and pDCs (D) in instantly fixed spleens from Cgas−/− BM (n = 5) and Cgas−/− + dKO BM (n = 4) mice relative to those from dKO BM mice (n = 4). Individual fold change values were calculated as ΔMFIi = (MFIi, untreated – MFIi, λPP) divided by the average of ΔMFIi values obtained from dKO BM mice. Data are represented as mean + SEM. Experiments in (B–D) were performed twice, and data are representative of a single experiment. Statistically significant differences were determined by two-tailed unpaired Mann-Whitney U test (p < 0.05). See also Figure S1.
Figure 2
Figure 2
Delivery of cGAMP from radioresistant cells to immune cells induces tonic IFN and NF-κB signaling in Trex1 deficiency (A) Global gene expression analysis by 3′-mRNA seq. Gene and sample-wise hierarchical clustering based on differentially expressed genes (non-adjusted p value <0.05, n = 660) within the dataset of spleen tissue from Cgas−/− BM and dKO BM mice. Gene expression values are Z score standardized. For visualization purposes Z scores were limited to numbers between −2 and 2. (B) PCA plot of spleen tissue data from Cgas−/− BM and dKO BM mice. PCA is based on differentially expressed genes (non-adjusted p value <0.05, n = 684). (C) Volcano plot indicating transcriptomic changes between Cgas−/− BM and dKO BM mice. Genes with a non-adjusted p value <0.05 and a signed fold change >2 are colored in red (upregulated in Cgas−/− KO BM mice) and blue (upregulated in dKO BM mice). Differentially expressed genes with an adjusted p value < 0.05 are labeled. (D) Normalized Enrichment Scores (NES) of Hallmark gene sets significantly upregulated (FDR q value <0.01) in spleen tissue from Cgas−/− BM mice compared with that from dKO BM mice in a pre-ranked Gene Set Enrichment Analysis (GSEA) based on a metric score calculated by log2(fold change) x (-log10(p value)). n = 5 mice per group. (E) Percentage of splenic classical monocytes and red pulp macrophages with high expression of IκBα (n = 7 for Cgas−/− BM mice, n = 6 for dKO BM mice). (F) Fold change of p-RelA mean fluorescence intensity (MFI) of classical monocytes and red pulp macrophages in instantly fixed spleens from Cgas−/− BM (n = 7) and dKO BM (n = 6) mice. Individual fold change values were calculated as ΔMFIi = (MFIi, untreated – MFIi, λPP) divided by the average of ΔMFIi values obtained from dKO BM mice. (G) Histograms display representative results for IκBα staining of gated classical monocytes and red pulp macrophages. Data in bar graphs are represented as mean + SEM. Data in (E-G) are pooled from two independent experiments. Statistically significant differences were determined by two-tailed unpaired Mann-Whitney U test (p < 0.05, ∗∗p < 0.01). See also Figure S2.
Figure 3
Figure 3
cGAMP transfer promotes T cell accrual in lymphoid tissue but not spontaneous T cell priming (A) Number of CD4+ and CD8+ T cells in spleens from Cgas−/− BM (n = 14), Cgas−/− + dKO BM (n = 14), and dKO BM mice (n = 16). (B) Mean fluorescence intensity (MFI) for Sca-1 of splenic CD4+ and CD8a+ T cells in Cgas−/− BM (n = 7), Cgas−/− + dKO BM (n = 7), and dKO BM mice (n = 6). (C) Representative Sca-1 staining histograms of splenic CD4+ and CD8a+ T cells. (D) Distribution of CD4+ and CD8a+ T cell subsets in spleens from Cgas−/− BM (n = 14), Cgas−/− + dKO BM (n = 14), and dKO BM mice (n = 16). (E) IFN-γ and TNF-α staining profiles of gated CD4+ T cells of PMA plus ionomycin stimulated splenocytes from Cgas−/− BM (n = 14), Cgas−/− + dKO BM (n = 14) and dKO BM mice (n = 16). Values indicate percentage of CD4+ T cells (mean). (F) Frequency of regulatory Foxp3+CD25+ cells among CD4+ T cells in spleens from Cgas−/− BM (n = 14), Cgas−/− + dKO BM (n = 14), and dKO BM mice (n = 16). Bar graphs show mean + SEM. Data are pooled from four (A, D, E) or two (B, C) independent experiments. Statistically significant differences were determined by two-tailed unpaired Mann-Whitney U test (p < 0.05, ∗∗p < 0.01). See also Figure S3.
Figure 4
Figure 4
Transmission of cGAMP is unable to induce B cell differentiation into plasmablasts and autoantibody production (A) Number of B cells in spleens from Cgas−/− BM (n = 14), Cgas−/− + dKO BM (n = 14), and dKO BM mice (n = 16). (B) Mean fluorescence intensity (MFI) for Sca-1 of splenic B cells in Cgas−/− BM (n = 7), Cgas−/− + dKO BM (n = 7), and dKO BM mice (n = 6). (C) Representative Sca-1 staining histograms of splenic B cells. (D) Contour plots show the gating strategy for B cells (orange gate) and AFCs (green gate). The histogram illustrates expression of Blimp-1, which drives the terminal differentiation of B cells to plasma cells, in B cells and AFCs. (E) Percentage of splenic AFCs that are proliferating (Ki67+) or undergoing cell death (EMA+) in Trex1−/− mice (n = 5). (F) Total numbers of AFCs in spleens from Cgas−/− BM (n = 14), Cgas−/− + dKO BM (n = 14), and dKO BM mice (n = 16). (G and H) Serum concentrations of anti-nucleosome IgG (G) and anti-myosin IgG (H) in Cgas−/− BM, Cgas−/− + dKO BM, dKO BM, Trex1−/−, lupus-prone MRL.Faslpr, and WT mice. Each dot represents an individual mouse; horizontal lines represent median values. Data in bar graphs are represented as mean + SEM. Data are pooled from four (A, F) or two (B) independent experiments. Statistically significant differences were determined by two-tailed unpaired Mann-Whitney U test (p < 0.05).
Figure 5
Figure 5
cGAMP travel inhibits lymphocyte and myeloid cell death (A) Representative staining histograms for MHC-II and CD86 of gated cDCs from Cgas−/− BM (n = 9), Cgas−/− + dKO BM (n = 10), and dKO BM mice (n = 11). Values indicate the mean of the mean fluorescence intensity (MFI). (B) Number of myeloid cell subsets in spleens from Cgas−/− BM (n = 14), Cgas−/− + dKO BM (n = 14), and dKO BM mice (n = 16). (C) Percentage of dying cells (FSCloFITC-VAD-FMK+) among lymphocyte and myeloid cell subsets in spleens from Cgas−/− BM (n = 6) and dKO BM mice (n = 6). (D) Flow cytometry plots show gating of dying T cells in spleens of Cgas−/− BM and dKO BM mice. Numbers indicate percentage of T cells (mean). Results are summarized in (C, left). (E) Splenocytes from WT and Sting1gt/gt mice were treated with various concentrations of cGAMP (0, 0.2, 1.0, 10, and 50 μg/mL). After 12h, dying cells (FSCloFITC-VAD-FMK+) were quantified by flow cytometry. Data in (A–D) are pooled from three (A), four (B) or two (C and D) independent experiments. Bar graphs show mean + SEM. Data in (E) display mean ± SEM of technical replicates (n = 4) of one representative experiment out of two. Statistically significant differences were determined by two-tailed unpaired Mann-Whitney U test (p < 0.05, ∗∗p < 0.01, ∗∗∗∗p < 0.0001). See also Figure S4.
Figure 6
Figure 6
Intercellular cGAMP passage induces interface dermatitis after UV light exposure (A and B) Representative images of H&E-stained sections of hearts (A) and tongues (B) from Cgas−/− BM, Cgas−/− + dKO BM, and dKO BM mice. Scale bars equal 50 μm for hearts and 100 μm for tongues. (C and D) Inflammation in hearts (C) and tongues (D) was scored from 1 to 3. Shown are scores of Cgas−/− BM, Cgas−/− + dKO BM, and dKO BM mice. (E) Representative images of H&E-stained skin sections from Cgas−/− BM, Cgas−/− + dKO BM, and dKO BM mice after UV stimulation. Yellow arrows highlight areas of cell-poor interface dermatitis with vacuolization at the dermoepidermal junction as it occurs in cutaneous lupus erythematosus. Scale bar equals 50 μm. (F) Interface dermatitis was scored from 0 to 3. Shown are scores of Cgas−/− BM, Cgas−/− + dKO BM, and dKO BM mice. (G) Representative images of Ly6G/Ly6C (Gr-1) staining (pink) of skin sections from Cgas−/− BM, Cgas−/− + dKO BM, and dKO BM mice after UV stimulation. Scale bar equals 20 μm. In scatter dot plots each dot depicts an individual mouse and horizontal lines represent median values. Statistically significant differences were determined by two-tailed unpaired Mann-Whitney U test (p < 0.05, ∗∗∗p < 0.001). See also Figures S5 and S6.

References

    1. Ablasser A., Schmid-Burgk J.L., Hemmerling I., Horvath G.L., Schmidt T., Latz E., Hornung V. Cell intrinsic immunity spreads to bystander cells via the intercellular transfer of cGAMP. Nature. 2013;503:530–534. - PMC - PubMed
    1. Ablasser A., Hemmerling I., Schmid-Burgk J.L., Behrendt R., Roers A., Hornung V. TREX1 deficiency triggers cell-autonomous immunity in a cGAS-dependent manner. J. Immunol. 2014;192:5993–5997. - PubMed
    1. Aga E., Mukherjee A., Rane D., More V., Patil T., van Zandbergen G., Solbach W., Dandapat J., Tackenberg H., Ohms M. Type-1 interferons prolong the lifespan of neutrophils by interfering with members of the apoptotic cascade. Cytokine. 2018;112:21–26. - PubMed
    1. Brault M., Olsen T.M., Martinez J., Stetson D.B., Oberst A. Intracellular nucleic acid sensing triggers necroptosis through synergistic type I IFN and TNF signaling. J. Immunol. 2018;200:2748–2756. - PMC - PubMed
    1. Bridgeman A., Maelfait J., Davenne T., Partridge T., Peng Y., Mayer A., Dong T., Kaever V., Borrow P., Rehwinkel J. Viruses transfer the antiviral second messenger cGAMP between cells. Science. 2015;349:1228–1232. - PMC - PubMed