. 2020;1(1):46-58.
doi: 10.1038/s43018-019-0003-0. Epub 2019 Dec 9.

PAK4 inhibition improves PD-1 blockade immunotherapy

Affiliations

PAK4 inhibition improves PD-1 blockade immunotherapy

Gabriel Abril-Rodriguez et al. Nat Cancer. 2020.

Erratum in

  • Publisher Correction: PAK4 inhibition improves PD-1 blockade immunotherapy.
    Abril-Rodriguez G, Torrejon DY, Liu W, Zaretsky JM, Nowicki TS, Tsoi J, Puig-Saus C, Baselga-Carretero I, Medina E, Quist MJ, Garcia AJ, Senapedis W, Baloglu E, Kalbasi A, Cheung-Lau G, Berent-Maoz B, Comin-Anduix B, Hu-Lieskovan S, Wang CY, Grasso CS, Ribas A. Abril-Rodriguez G, et al. Nat Cancer. 2020 Feb;1(2):264. doi: 10.1038/s43018-020-0025-7. Nat Cancer. 2020. PMID: 35122015 No abstract available.

Abstract

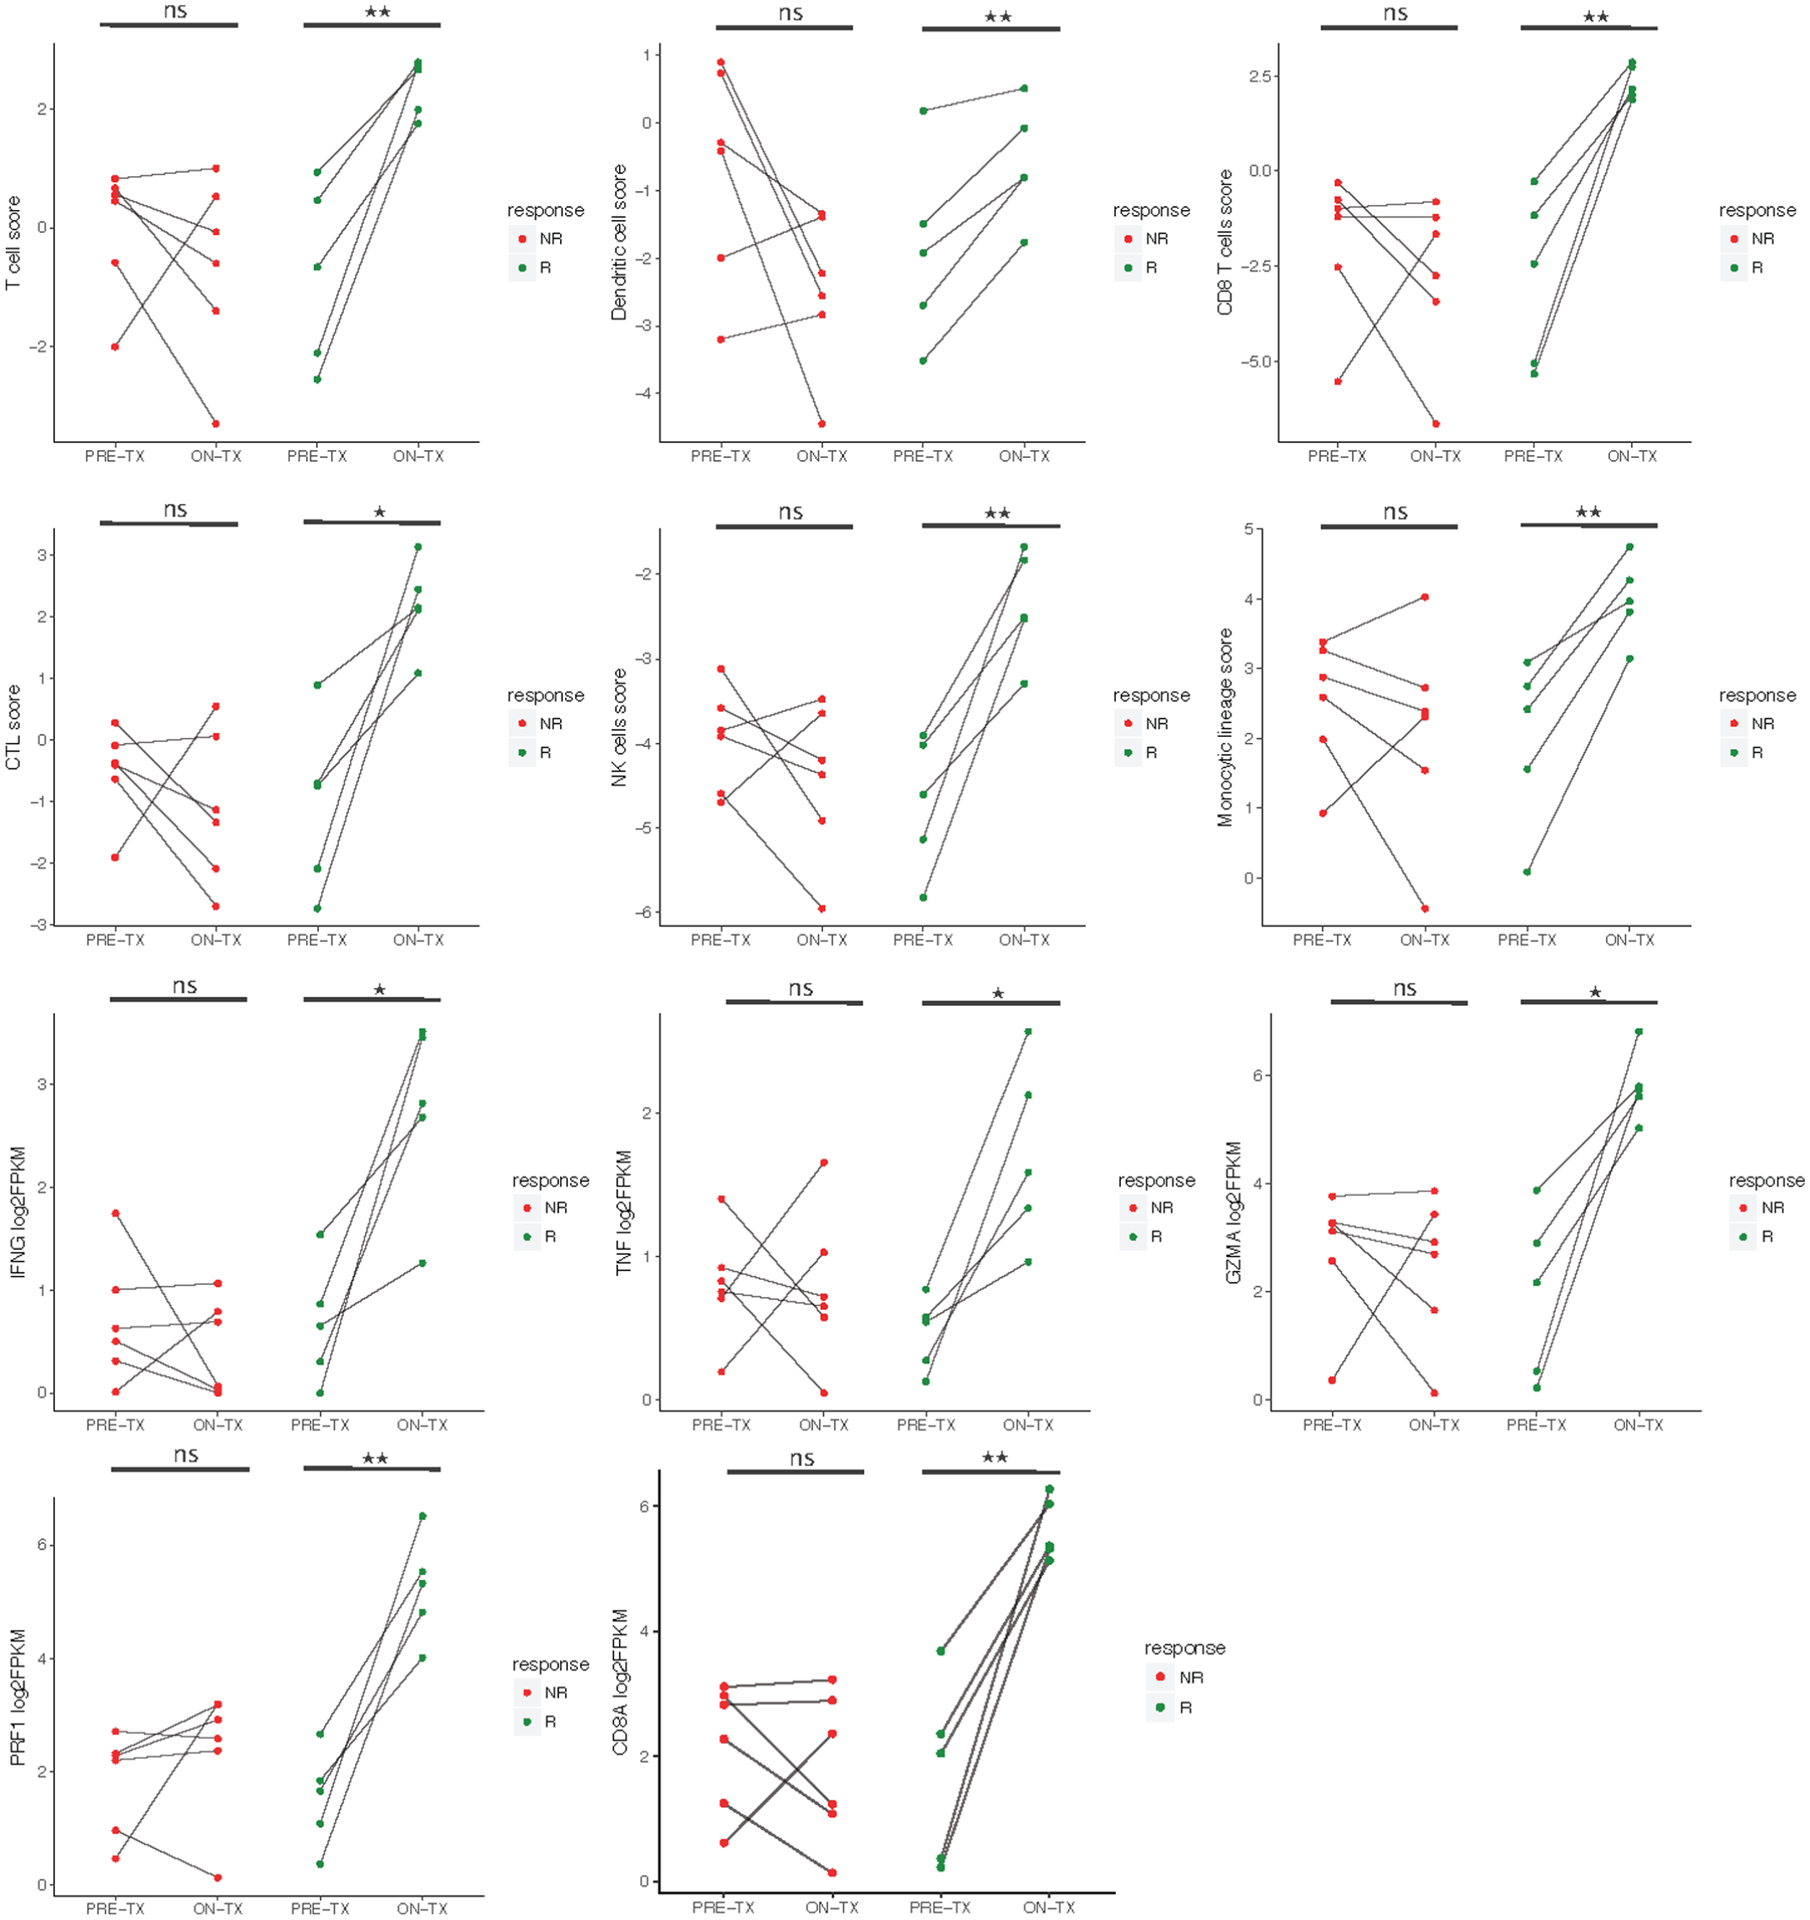
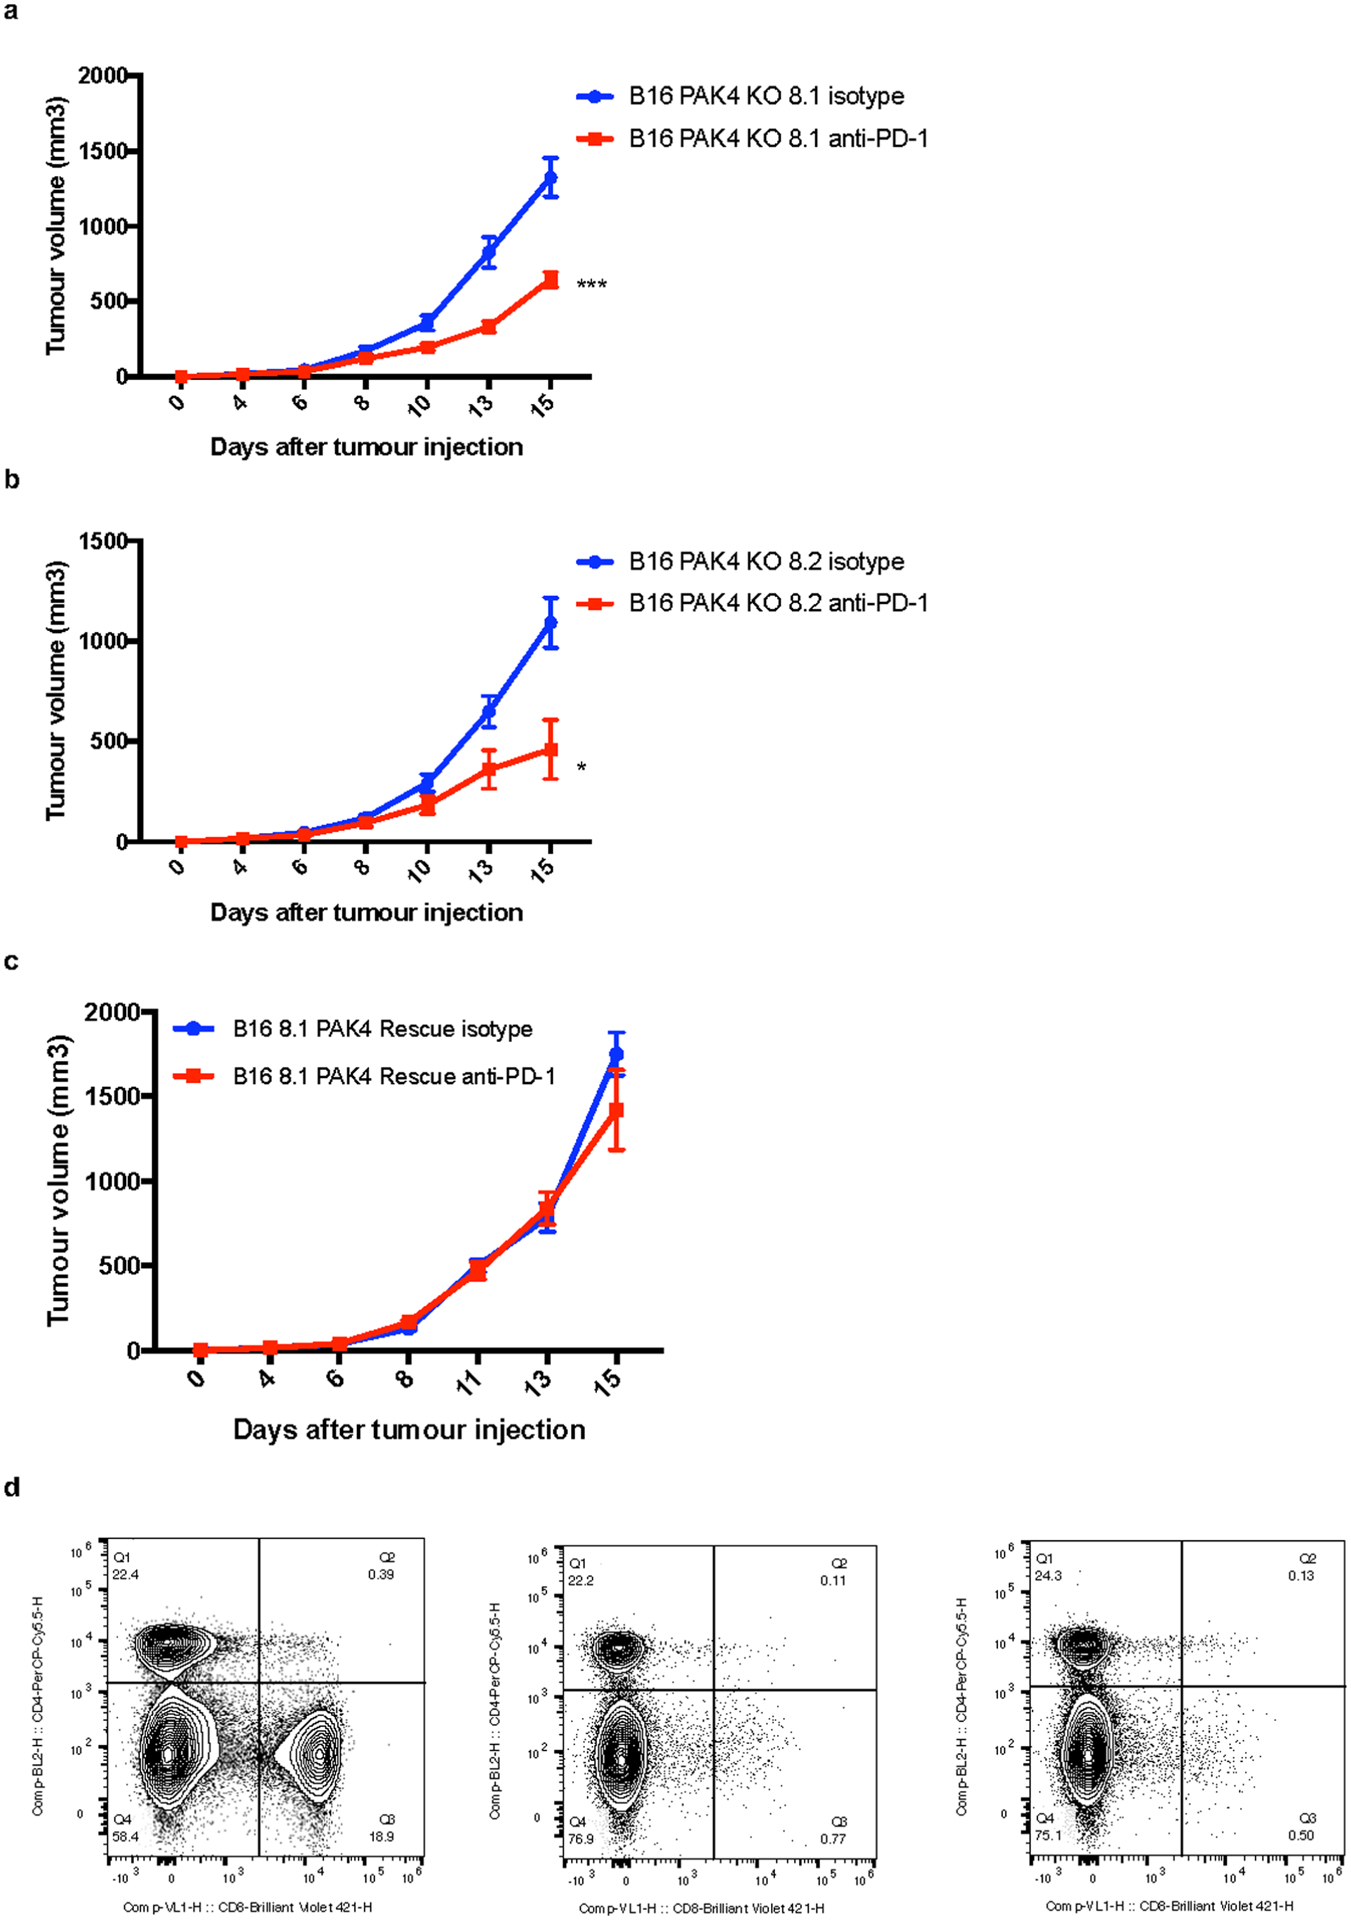
Lack of tumor infiltration by immune cells is the main mechanism of primary resistance to programmed cell death protein 1 (PD-1) blockade therapies for cancer. It has been postulated that cancer cell-intrinsic mechanisms may actively exclude T cells from tumors, suggesting that the finding of actionable molecules that could be inhibited to increase T cell infiltration may synergize with checkpoint inhibitor immunotherapy. Here, we show that p21-activated kinase 4 (PAK4) is enriched in non-responding tumor biopsies with low T cell and dendritic cell infiltration. In mouse models, genetic deletion of PAK4 increased T cell infiltration and reversed resistance to PD-1 blockade in a CD8 T cell-dependent manner. Furthermore, combination of anti-PD-1 with the PAK4 inhibitor KPT-9274 improved anti-tumor response compared with anti-PD-1 alone. Therefore, high PAK4 expression is correlated with low T cell and dendritic cell infiltration and a lack of response to PD-1 blockade, which could be reversed with PAK4 inhibition.


Conflict of interest statement

Competing interests G.A.-R. has received honoraria for consulting with Arcus Biosciences. W.S. and E.B. were employees of Karyopharm Therapeutics when this study was conducted. A.R. has received honoraria for consulting with Amgen, Bristol-Myers Squibb, Chugai, Genentech, Merck, Novartis, Roche and Sanofi, is or has been a member of the scientific advisory board, and holds stock in Advaxis, Arcus Biosciences, Bioncotech Therapeutics, Compugen, CytomX, Five Prime, FLX Bio, ImaginAb, IsoPlexis, Gilead Kite, Lutris Pharma, Merus, PACT Pharma, Rgenix and Tango Therapeutics. G.A.-R., D.Y.T., C.S.G. and A.R. are inventors in a patent application covering the use of PAK4 inhibitors for cancer immunotherapy.

Figures

Extended Data Fig. 1 |
Extended Data Fig. 1 |. Differential change in immune populations between non-responding and responding biopsies during anti-PD-1 therapy.
Comparison (two-sided, paired T-test) of each of the immune populations and immune markers between baseline and on-treatment tumour samples for responding (n= 5) and non-responding (n= 6) biopsies. From left to right: T cell score (R P= 0.007, NR P= 0.44), Dendritic cell score (R P= 0.009, NR P= 0.08), CD8 T cell score (R P= 0.006, NR P= 0.48), CTL score (R P= 0.01, NR P= 0.43), NK cell score (R P= 0.006, NR P= 0.32), Monocyte lineage score (R P= 0.004, NR P= 0.48), IFNg (R P= 0.01, NR P= 0.47), TNF (R P= 0.01, NR P= 0.9), GZMA (R P= 0.01, NR P= 0.73), PRF1 (R P= 0.004, NR P= 0.29) and CD8A (R P= 0.004, NR P= 0.52) expression. Increase in all immune populations and markers was significant (P < 0.05) only in responding biopsies. *P <0.05, **P < 0.01; ns, not significant
Extended Data Fig. 2 |
Extended Data Fig. 2 |. PAK4 expression analysis with immune infiltration and overlap with S100 and β-catenin staining.
a, Comparison of exclusion up Jerby-Arnon score expression (P = 3.28e-05) between tumour biopsies within the upper (n = 15) and lower (n = 15) quartile of PAK4 expression. b, PAK4 correlation with Jerby-Arnon score expression (n = 60) (R = 0.65, P = 1.78e-08). Exclusion up Jerby-Arnon was obtained based on the geometric mean of the 302 gene from Jerby-Arnon et al. c, CD8A (R = −0.39, P = 6.07e-05), TNF (R = −0.49, P = 1.89e-07), GZMA (R = −0.45, P = 2.47e-06), PRF1 (R = −0.28, P = 4e-03) and the different immune populations assessed using MCP-Counter: T cells (R = −0.39, P = 4.41e-05), CD8 T cells (R = −0.36, P = 1.71e-04), cytotoxic lymphocytes (R = −0.28, P = 4.9e-03) and dendritic cells (R = −0.57, P = 3.95e-10). n= 99 for all plots. d, Quantification of PAK4 positive cells out of S100 total positive cells. PT0158_tx2 and PT0112_tx are two biopsies with low T cell infiltration and high PAK4 expression while PT0294_tx2 and PT0349_tx have low PAK4 and high T cell infiltrate as determined by RNAseq. e, Quantification of PAK4 positive cells out of β-catenin total positive cells. From top to bottom box-plots define the maximum, 3rd quartile, median, 1st quartile and minimum values a. P values obtained using two-sided Welch’s t-test a. Correlations were calculated applying Pearson’s correlation coefficient test b, c
Extended Data Fig. 3 |
Extended Data Fig. 3 |. Validation of the generation of a PAK4 KO B16 cell line.
a, b, c TIDE analysis of the B16 PAK4 KO clones: 6.2, 8.1 and 8.2 respectively. d, e, Analysis of PAK4 protein expression in the three B16 PAK4 KO clones, B16 WT CRISPR control and rescue cell lines by Western blot. Results are representative from three independent experiments. Unprocessed blot images are provided as a Source Data file d, e.
Extended Data Fig. 4 |
Extended Data Fig. 4 |. PAK4 depletion impact on nuclear protein β-catenin and WNT signalling activity.
a, Negative control for the Topflash experiment using the Fopflash luciferase vector which contains a mutated version of the TCF/LEF binding motifs. There are no changes in Fopflash activity upon stimulation with Wnt-3a ligand for 8 hours in any of the tested cell lines (n= 3 per group) (P > 0.05 for all comparisons). b, Baseline WNT activity levels assessed by Topflash assay (n= 3 per group). Values were normalized to B16 WT CC cell lines and no significant WNT activity changes were observed between PAK4 WT and KO cell. c, Immunoblots for nuclear β-catenin protein levels show no differences between B16 WT CRISPR control, PAK4 KO and PAK4 rescue cells. Results are representative from three independent experiments. Means +/− SEM two-tailed unpaired t-test a, b. Unprocessed blot images and raw data are provided as a Source Data file a-c.
Extended Data Fig. 5 |
Extended Data Fig. 5 |. PAK4 inhibition disrupts WNT signalling and melanogenesis.
a, Cells were cultured with 2μM KPT-9274 for 72 hours before nuclear protein isolation. Showing immunoblots for nuclear β-catenin, nuclear phosphor-β-catenin (S675) and nuclear PAK4 protein levels. Results are representative from two independent experiments. b, Cells were cultured with 2μM KPT-9274 for 72 hours and Wnt-3a for 8 hours prior to Topflash assay (n= 3 per group). Pharmacological inhibition of PAK4 significantly decreases sensitivity to Wnt-3a stimulation (P= 0.005 for WT Wnt3a vs WT KPT-9274 + Wnt3a comparison). c, Baseline WNT activity levels assessed by Topflash assay of cell treated with 2μM KPT-9274 for 72 hours (n= 3 per group) (P > 0.05). Values were normalized to untreated B16 WT CC cells. d, RT-PCR for tyrosinase expression show that PAK4 depletion reduces the expression levels of this gene. Showing means +/− SEM. Results are normalized to B16 WT CRISPR control levels and then log2 transformed (n= 3). e, For image, cells were cultured and harvest upon reaching 80% confluency. B16 WT CRISPR Control cell line maintains melanin production over time while PAK4 KO clones lose their pigmentation. Results are representative from three independent experiments. Means +/− SEM two-tailed unpaired t-test b, c. Unprocessed blots and raw data are provided as a Source Data file a-c.
Extended Data Fig. 6 |
Extended Data Fig. 6 |. In vivo experiments with additional B16 PAK4 KO and rescue clones and CD8 depletion validation.
a, Tumour growth curves for B16 PAK4 KO 8.1 tumours treated with isotype (blue, n = 10) or anti-PD-1 (red, n = 12) (P= 0.00024, day 15). b, Tumour growth curves for B16 PAK4 KO 8.2 tumours treated with isotype (blue, n = 10) or anti-PD-1 (red, n = 10) (P= 0.02, day 15). In both PAK4 KO cell lines anti-PD-1 treated tumours showed decreased tumour growth compared to untreated tumours. c, Tumour growth curves for B16 8.1 PAK4 rescue tumours treated with isotype (blue, n = 5) or anti-PD-1 (red, n = 5). Anti-PD-1 treatment did not result in any significant anti-tumour efficacy (P= 0.80, day 15). d, Flow cytometry analysis of CD8 positive splenocytes after CD8 depletion. Left panel show splenocytes pattern without anti-CD8 treatment (CD8 population = 18.9%) while middle and right panel show splenocytes derived from two independent mice treated with anti-CD8 antibody (CD8 population = 0.77% and 0.50% respectively). Plotting the mean +/− s.e.m a-c. Statistical significance and correction for multiple comparisons was calculated using Holm-Sidak method a-c. Raw data is provided as a Source Data file a-c. *P <0.05, **P < 0.01, ***P <0.001, ****P < 0.0001. ns, not significant.
Extended Data Fig. 7 |
Extended Data Fig. 7 |. PAK4 KO validation and sensitivity to TNF in MC38 cells.
a, TIDE analysis of the MC38 PAK4 KO 6.9 clone. b, Analysis of PAK4 protein expression in MC38 PAK4 KO 6.9 clone and MC38 WT by Western blot. Results are representative from two independent experiments. c, Cells were plated by triplicate into 96 well plates and then treated with TNF at 100ng/mL. Cell proliferation was measured by cell confluence using the IncuCyte S3 Live Cell Analysis System. TNF treatment decreased proliferation of MC38 WT, MC38 PAK4 KO 6.9 and MC38 PAK4 KO 6.10 cells by 41%, 95% and 74% respectively compared to untreated cells (means +/− SEM). Results are representative from three biologically independent experiments. Unprocessed blots are provided as a Source Data file b.
Fig. 1 |
Fig. 1 |. Responding biopsies present features of an adaptive immune response, while non-responding biopsies lack sufficient immune cell infiltration.
a, Schematic of the analysis of tumor biopsies from patients with metastatic melanoma included in the RNA-Seq studies. b, Heatmap of a CD8 T cell effector signature for on-treatment biopsies (non-responding (NR; red; n = 14) and responding (R; blue; n = 13)). P = 1 × 10⁻⁴. c, GSEA of on-treatment responding biopsies showing the top signatures for the Gene Ontology gene set. d, Differences in gene expression between non-responding (n = 14) and responding biopsies (n = 13) for CD8A (P = 1.45 × 10⁻⁵), TNF (P = 6.04 × 10⁻⁴), GZMA (P = 6.76 × 10⁻⁶) and IFNG (P = 1.11 × 10⁻⁴). e, Differences in immune population scores between non-responding and responding on-treatment biopsies (n = 13), including T cell score (P = 1.21 × 10⁻⁵), CD8 T cell score (P = 2.04 × 10⁻⁵), cytotoxic lymphocytes score (P = 1.14 × 10⁻⁵) and dendritic cell score (P = 1.90 × 10⁻⁵). From top to bottom, box plots in d and e define the maximum, third quartile, median, first quartile and minimum values. P values were determined by two-sided Welch’s t-test (***P < 0.001; ****P < 0.0001).
Fig. 2 |
Fig. 2 |. PAK4 expression is enriched in non-infiltrated tumor biopsies and negatively correlates with immune markers in melanoma.
a,b, Volcano plots derived from differential gene expression analysis between the upper and lower quartiles of the dendritic cell score, using both pre- and on-treatment samples. PAK4 expression was enriched in the samples with low dendritic cell scores in our UCLA cohort (a; n = 30 biopsies; q = 1.19 × 10⁻⁵), as well as in the Riaz et al. validation cohort (b; n = 50 biopsies; q = 1.59 × 10⁻¹¹). c, PAK4 expression was also enriched in samples with low T cell infiltration (q = 2.74 × 10⁻⁷), and low expression of CD8A (q = 9.08 × 10⁻⁹), TNF (q = 6.67 × 10⁻¹²) and IFNG (q = 1.9 × 10⁻⁶) (n = 15 biopsies per group for each comparison). In ac, P values were calculated using the negative binomial generalized linear model fitting and Wald significance test, while q values were obtained by applying the Benjamini–Hochberg method. d, PAK4 expression negatively correlates with log2[FPKM] expression of the known immune markers CD8A (r = −0.54; P = 7.95 × 10⁻⁶), TNF (r = −0.69; P = 1.12 × 10⁻⁹), GZMA (r = −0.59; P = 7.95 × 10⁻⁷) and PRF1 (r = −0.41; P = 6.20 × 10⁻⁴), as well as the different immune populations assessed using MCP-counter: T cells (r = −0.62; P = 1.04 × 10⁻⁷), CD8 T cells (r = −0.55; P = 5.25 × 10⁻⁶), cytotoxic lymphocytes (r = −0.46; P = 1.90 × 10⁻⁴) and dendritic cells (r = −0.49; P = 6.60 × 10⁻⁵) (n = 60 biopsies for all correlations). Correlations were calculated applying Pearson’s correlation coefficient test. e, Images from biopsies of two representative patients of non-responding/low T cell infiltration (top) and responding/high T cell infiltration (bottom). Slides were stained with S100, PAK4 and CD8. The results showed co-localization of PAK4 and S100, and validation of the exclusivity between PAK4 and CD8 expression. Scale bars: 100 μm.
Fig. 3 |
Fig. 3 |. PAK4 expression correlates with WNT genes in tumor biopsies and regulates WNT signaling activation in vitro.
a, Comparison of MYC (P = 1.32 × 10⁻⁵) and β-catenin (CTNNB1; P = 7.00 × 10⁻⁴) log2[FPKM] expression values between tumor biopsies within the upper (n = 15) and lower (n = 15) quartile of PAK4 expression using the UCLA cohort. b, Left: comparison of WNT scores (P = 3 × 10⁻³) between tumor biopsies within the upper (n = 15) and lower (n = 15) quartile of PAK4 expression. Right: correlation (n = 60; r = 0.45; P = 2.96 × 10⁻⁴) between WNT scores and log2[FPKM] PAK4 expression values (blue: responders; red: non-responders; yellow: stable disease; gray: pre-treatment). The WNT score was obtained based on the geometric mean of the following WNT-related genes: APC, MYC, CTNNB1, DKK2 and VEGFA. In a and b, P values were determined by two-sided Welch’s t-test (a and b (left)) and Pearson’s correlation coefficient (b (right)) (**P < 0.01; ***P < 0.001; ****P < 0.0001). From top to bottom, box plots show the maximum, third quartile, median, first quartile and minimum values. c, Images from biopsies of two representative patients of non-responding/low T cell infiltration (top) and responding/high T cell infiltration (bottom). Slides were stained with β-catenin, PAK4 and CD8. Scale bars: 100 μm. d,e, Topflash WNT activity assays indicating that B16 PAK4 KO cells failed to upregulate WNT signaling as high as PAK4 CRISPR control WT cells (d; P = 0.0054 for B16 WT CRISPR control (CC) versus B16 KO 6.2; P = 0.0026 for B16 WT CC versus B16 KO 8.1; P = 0.0033 for B16 WT CC versus B16 KO 8.2), while rescuing PAK4 expression increased basal WNT activity (e; P = 0.0002 for B16 KO 6.2 versus B16 KO 6.2 rescue; P < 0.0001 for B16 KO 8.1 versus B16 KO 8.1 rescue; P = 0.0004 for B16 KO 8.2 versus B16 KO 8.2 rescue) (n = 3 technical replicates per group). The results are representative of three independent experiments. In d and e, data represent means ± s.e.m. and the results were compared by two-tailed unpaired t-test. f, Immunoblot for β-catenin S675 phosphorylation. Phosphorylation levels were decreased in B16 PAK4 KO cells compared with PAK4 WT cells and restored in PAK4 rescue cell lines. The results are representative of three independent experiments. Source data are available for df.
Fig. 4 |
Fig. 4 |. PAK4 expression is enriched in non-responding tumor biopsies and negatively correlates with immune markers in multiple tumor types.
a, Pan-cancer analysis using TCGA transcriptome data shows the negative correlation between PAK4 expression and T cell (blue), cytotoxic T cell (red) and dendritic cell scores (yellow) across 32 tumor types (the sample size for each cancer type and the associated P value for each correlation can be found in Supplementary Table 3). Correlations were evaluated using Spearman’s correlation coefficient. DLBC, diffuse large B-cell lymphoma. b,c, On-treatment non-responding biopsies (n = 14) have higher levels of log2[FPKM] PAK4 expression compared with responding biopsies (b; n = 13; P = 4.72 × 10⁻³), and are enriched in gene signatures related to known oncogenic signatures involved in immune cell exclusion, as observed by GSEA using Gene Ontology gene sets as targets (c). From top to bottom, box plots in b show the maximum, third quartile, median, first quartile and minimum values, and the P value was determined by two-sided Welch’s t-test (**P < 0.01).
Fig. 5 |
Fig. 5 |. Inhibition of PAK4 reverses tumor-specific T cell exclusion and sensitizes tumors to PD-1 blockade.
a, Tumor growth curves for B16 PAK4 KO 6.2 tumors (n = 16 per group) treated with isotype (blue) or anti-PD-1 (red). Anti-PD-1-treated B16 PAK4 KO tumors showed decreased tumor growth compared with untreated B16 PAK4 KO tumors (P = 3.65 × 10⁻⁶ at day 14). b, Tumor growth curves for B16 WT CC tumors treated with isotype (blue; n = 14) or anti-PD-1 (red; n = 13). No significant differences were observed in tumor growth (P = 0.91 at day 14). c, Tumor growth curves for B16 6.2 PAK4 rescue tumors treated with isotype (blue; n = 5) or anti-PD-1 (red; n = 5). Anti-PD-1 treatment did not have significant anti-tumor efficacy when restoring PAK4 expression (P = 0.74 at day 14). d, Tumor growth for B16 PAK4 KO 6.2 tumors with CD8 depletion (n = 5) (P = 4.31 × 10⁻⁵ at day 14 for B16 PAK4 KO anti-PD-1 versus B16 PAK4 KO anti-PD-1 + anti-CD8). e, T-distributed stochastic neighbor embedding plots for each of the following four groups: B16 PAK4 KO isotype; B16 PAK4 KO anti-PD-1; B16 WT isotype; and B16 WT anti-PD-1. The different immune populations were: myeloid cell (My); B cells (B); CD8 T cells (CD8 eff); CD4 T cells (CD4 eff); T cells (T); natural killer cells (NK); Ly6G+ cluster (Ly6G) and unidentified cluster (UIC). f, Percentage of T cell and natural killer cell (NK cell) population from CD45+ cells. PAK4 KO treated tumors had increased T and NK cell infiltration relative to WT treated tumors (median percentage: 16.18% for KO anti-PD-1; 4.99% for WT anti-PD-1; P < 0.05). PAK4 KO untreated tumors also showed increased T and NK cell infiltration relative to WT untreated tumors (median percentage: 11.89% for KO anti-PD-1; 1.57% for WT anti-PD-1; P = 0.02) (n = 4 mice per group). g, Percentage of T cell population from CD45+ cells. B16 PAK4 KO tumors presented increased T cell infiltration compared with B16 WT tumors (median percentage: 10% for KO; 1.37% for WT; P = 0.009) (n = 8 mice per group). In ad, f and g, means ± s.e.m are shown. Statistical significance and corrections for multiple comparisons were determined using the Holm–Šidak method (ad) or two-tailed unpaired t-test (f and g) (*P < 0.05; ****P < 0.0001). NS, not significant. Source data are available for ad, f and g.
Fig. 6 |
Fig. 6 |. Analysis of tumor-infiltrating immune cells by CyTOF.
a, Heatmap with the normalized median percentage for each of the immune markers in the different clusters obtained. Only clusters with a >0.5% frequency were analyzed. b, Tumor growth curves for the 16 samples (n = 4 per group) used for the CyTOF analysis. Data represent means ± s.e.m.
Fig. 7 |
Fig. 7 |. Pharmacological inhibition of PAK4 improves anti-PD-1 anti-tumor response.
a, Tumor growth curves for B16 WT melanoma tumors treated with KPT-9274 in combination with anti-PD-1 (n = 6; purple), KPT-9274 (n = 6; green) or anti-PD-1 (n = 6; red) versus controls (n = 6; blue). The combination of KPT-9274 and anti-PD-1 showed decreased tumor growth compared with both anti-PD-1 monotherapy (P = 0.01 at day 12) and KPT-9274 monotherapy (P = 0.0007 at day 12). Data represent means ± s.e.m. b, Tumor growth curves for MC38 WT tumors treated with KPT-9274 and anti-PD-1 (n = 7; purple), KPT-9274 (n = 5; green), anti-PD-1 (n = 5; red) and isotype (n = 3; blue). The combination of KPT-9274 and anti-PD-1 or KPT-9274 monotherapy resulted in significantly decreased tumor growth compared with anti-PD-1 alone (P = 0.01 for the combination group; P = 0.02 for KPT-9274 monotherapy; both at day 10). KPT-9274 was given twice daily from days 4–7 and then discontinued due to KPT-9274-associated toxicity. c, Tumor growth curves for MC38 WT and MC38 PAK4 KO tumors treated with PD-1 blockade (n = 7 for the MC38 PAK4 KO anti-PD-1 and MC38 PAK4 KO isotype groups; n = 4 for the MC38 WT isotype and MC38 WT anti-PD-1 groups). Treated tumors received four doses of anti-PD-1 in total. Both MC38 PAK4 KO untreated and anti-PD-1-treated tumors showed decreased tumor growth compared with the MC38 WT anti-PD-1-treated group (P = 0.001 for the WT isotype versus the KO isotype; P = 0.004 for WT anti-PD-1 versus KO anti-PD-1; both at day 21). Statistical significance and correction for multiple comparisons were calculated using the Holm–Šidak method (*P < 0.05; **P < 0.01). Source data are available for ac.

Comment in

  • PAK4 as a cancer immune-evasion target.
    Gajewski TF, Fessler J. Gajewski TF, et al. Nat Cancer. 2020 Jan;1(1):18-19. doi: 10.1038/s43018-019-0012-z. Nat Cancer. 2020. PMID: 35121838 No abstract available.

References

    1. Ribas A & Wolchok JD Cancer immunotherapy using checkpoint blockade. Science 359, 1350–1355 (2018). - PMC - PubMed
    1. Tumeh PC et al. PD-1 blockade induces responses by inhibiting adaptive immune resistance. Nature 515, 568–571 (2014). - PMC - PubMed
    1. Chen PL et al. Analysis of immune signatures in longitudinal tumor samples yields insight into biomarkers of response and mechanisms of resistance to immune checkpoint blockade. Cancer Discov. 6, 827–837 (2016). - PMC - PubMed
    1. Ayers M et al. IFN-γ-related mRNA profile predicts clinical response to PD-1 blockade. J. Clin. Invest 127, 2930–2940 (2017). - PMC - PubMed
    1. Riaz N et al. Tumor and microenvironment evolution during immunotherapy with nivolumab. Cell 171, 934–949.e15 (2017). - PMC - PubMed

Publication types

Substances