. 2021 Dec 17;31(1):97-110.
doi: 10.1093/hmg/ddab222.

Abnormal migration behavior linked to Rac1 signaling contributes to primordial germ cell exhaustion in Fanconi anemia pathway-deficient Fancg-/- embryos

Affiliations

Abnormal migration behavior linked to Rac1 signaling contributes to primordial germ cell exhaustion in Fanconi anemia pathway-deficient Fancg-/- embryos

Amandine Jarysta et al. Hum Mol Genet. .

Abstract

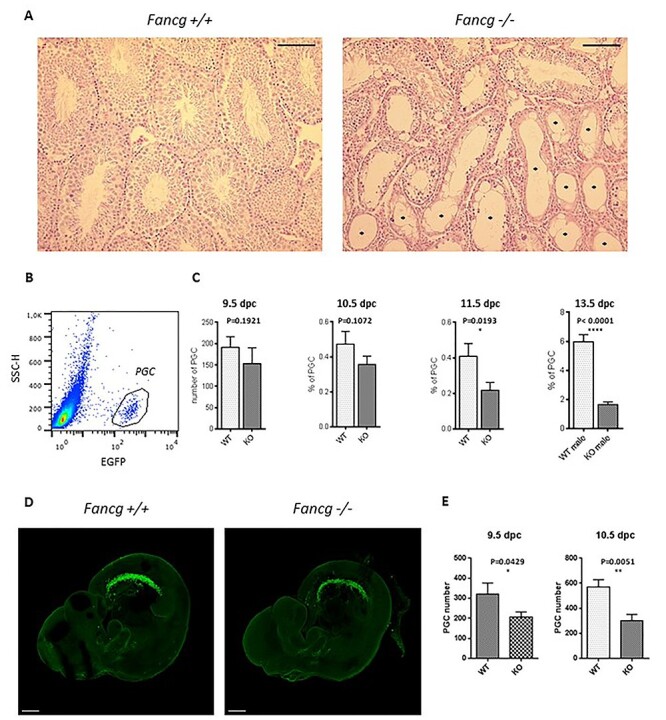
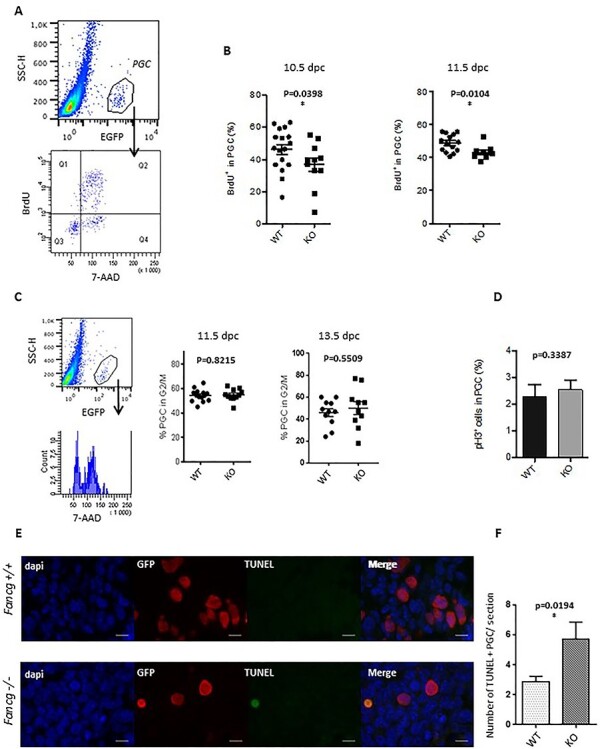
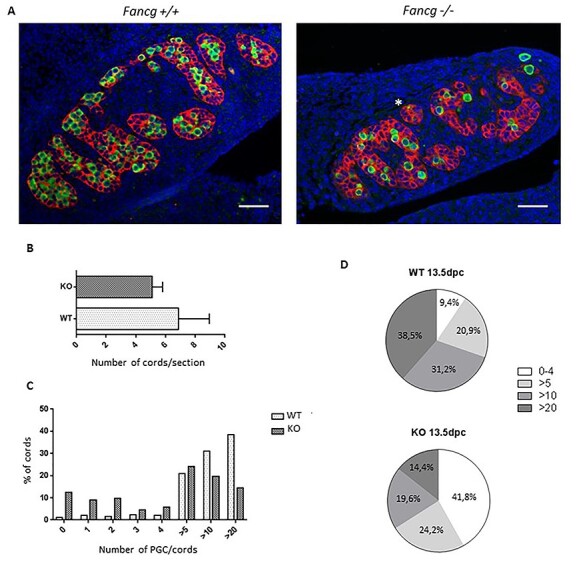
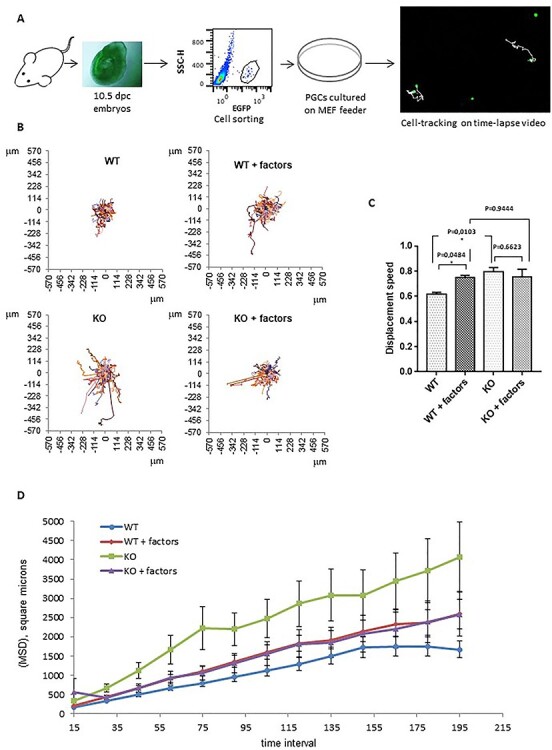
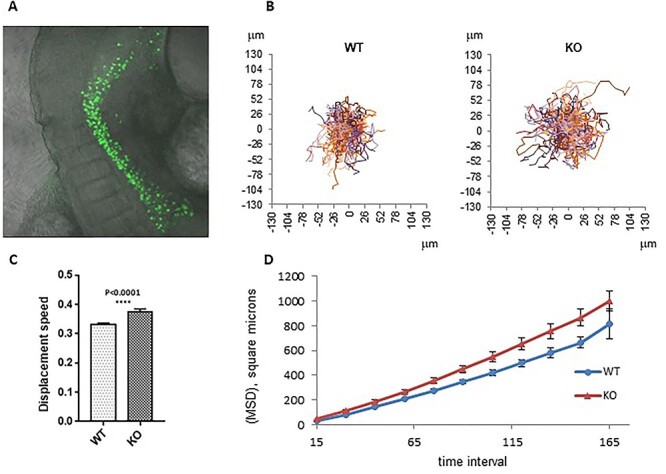
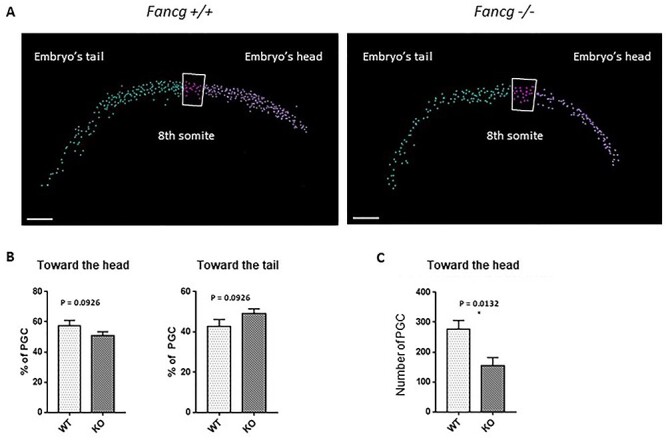
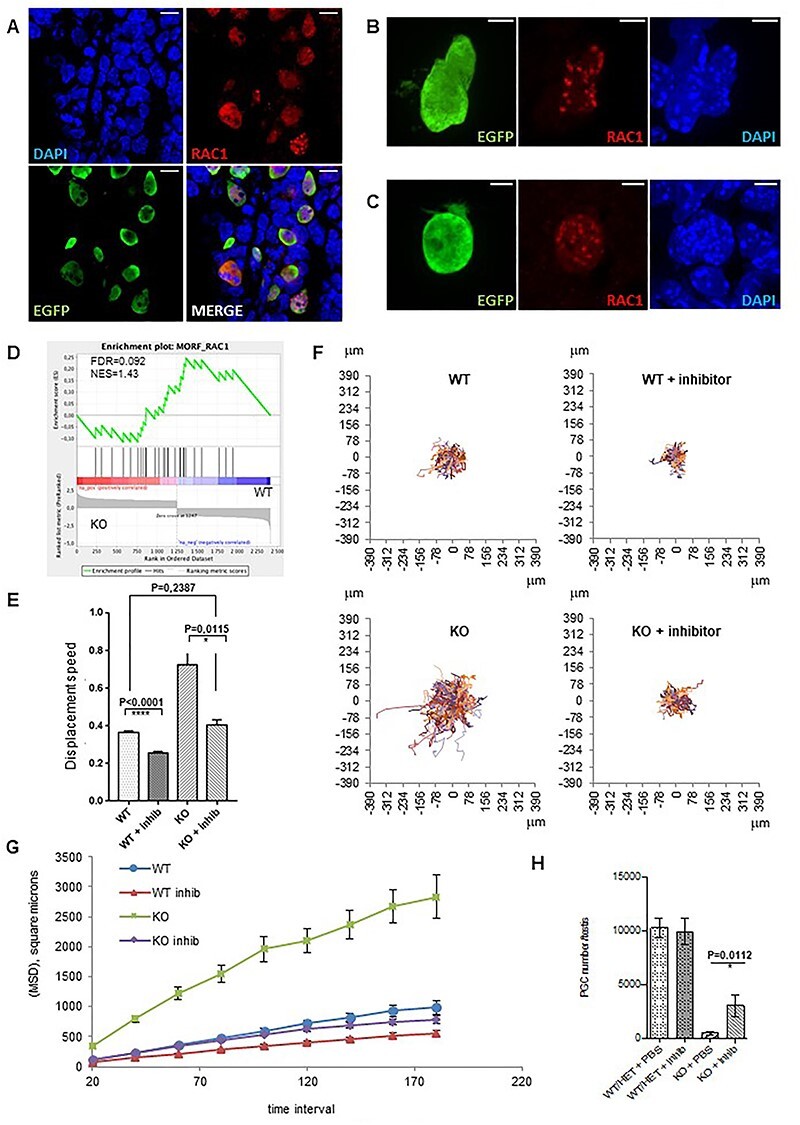
Fanconi anemia (FA) is a rare human genetic disorder characterized by bone marrow failure, predisposition to cancer and developmental defects including hypogonadism. Reproductive defects leading to germ cell aplasia are the most consistent phenotypes seen in FA mouse models. We examined the role of the nuclear FA core complex gene Fancg in the development of primordial germ cells (PGCs), the embryonic precursors of adult gametes, during fetal development. PGC maintenance was severely impaired in Fancg-/- embryos. We observed a defect in the number of PGCs starting at E9.5 and a strong attrition at E11.5 and E13.5. Remarkably, we observed a mosaic pattern reflecting a portion of testicular cords devoid of PGCs in E13.5 fetal gonads. Our in vitro and in vivo data highlight a potential role of Fancg in the proliferation and in the intrinsic cell motility abilities of PGCs. The random migratory process is abnormally activated in Fancg-/- PGCs, altering the migration of cells. Increased cell death and PGC attrition observed in E11.5 Fancg-/- embryos are features consistent with delayed migration of PGCs along the migratory pathway to the genital ridges. Moreover, we show that an inhibitor of RAC1 mitigates the abnormal migratory pattern observed in Fancg-/- PGCs.


Figures

Figure 1
Figure 1
Fancg  −/− mice exhibit loss of germinal cells in embryos and adult testis. (A) Hematoxylin–eosin-stained histological sections of testes of adult 3-month-old Fancg+/+ and Fancg−/− mice. Fancg−/− testis showed germinal aplasia with SCO tubules (*) (scale = 100 μm). (B) EGFP-positive PGC identification in E13.5 OG2:Fancg+/+ embryos using flow cytometry. (C) Quantification of the absolute number of PGCs per embryo using Trucount microbeads at E9.5 dpc wild-type (WT) n = 21, knockout (KO) n = 10), of the frequency of PGCs per embryo at E10.5 (WT n = 17, KO n = 15), and of the frequency of PGCs per gonads at E11.5 (WT n = 12, KO n = 11) and E13.5 (WT n = 8, KO n = 9). (D) Confocal microscopy analysis of E10.5 cleared embryos using an antibody against EGFP to identify PGCs (scale = 300 μm). (E) Automated cell counting of PGCs per embryo using Imaris software at E9.5 (WT n = 4, KO n = 5) and E10.5 (WT n = 4, KO n = 5).
Figure 2
Figure 2
Decreased proliferation rate and increased cell death of PGCs in Fancg−/− embryos at E11.5. (A) Identification of the proliferative BrdU-positive cell fraction (Q1 and Q2) in the EGFP-positive PGC population from E11.5 WT embryos. (B) Quantification of the proliferative fraction of PGCs at E10.5 (WT n = 17, KO = 11) and E11.5 (WT n = 14, KO = 15) in OG2:Fancg+/+ and OG2:Fancg−/− embryos. (C) DNA content analysis (7-AAD) of the EGFP-positive PGC population at E11.5 (WT n = 5, KO n = 4) and E13.5 (WT n = 11, KO n = 10). (D) Frequency of mitotic PHH3-positive PGCs counted from histological sections of testes in E13.5 OG2:Fancg+/+ and OG2:Fancg−/− embryos (WT n = 3, KO n = 3). (E) Detection of cell death by TUNEL assays in histological sections of E11.5 OG2:Fancg+/+ and OG2:Fancg−/− embryos. Nuclei counterstained by DAPI (blue), PGCs labeled with an antibody against EGFP (red) and the TUNEL-positive signal (green) are shown (scale = 10 μm). (F) Quantification of the number of TUNEL-positive dying cells per section at E11.5 (WT n = 6, KO n = 6).
Figure 3
Figure 3
E13.5 testis show a mosaic pattern of testicular cords containing PGCs and cords devoid of PGCs. (A) Histological sections of E13.5 OG2:Fancg+/+ and OG2:Fancg−/− male embryos. PGCs are labeled with an antibody against EGFP (green), Sertoli cells are labeled with an antibody against AMH (red) and nucleus are stained with DAPI [blue; (scale = 50 μm)]. (B) Number of testicular cords per histological section in OG2:Fancg+/+ and OG2:Fancg−/− E13.5 embryos (WT n = 3, KO n = 3). (C) Repartition of testicular cords (WT n = 5, KO n = 5) as a function of the number of PGCs contained in each cord in E13.5 testis. (D) Pie chart summarizing the distribution of cords in E13.5 OG2:Fancg+/+ and OG2:Fancg−/− testis observed in (C).
Figure 4
Figure 4
E10.5 OG2:Fancg−/− PGCs display in vitro abnormal migration behavior. (A) Summary of the in vitro migration assay of sorted PGCs from E10.5 embryos tracked by EGFP fluorescence (acquisition over 7.5 h, every 15 min). (B) Movements of OG2:Fancg+/+ and OG2:Fancg−/− PGCs without and with migration factors (KITL, SDF-1, BMP4 and LIF) shown from the same origin point. (C) Average speed and (D) MSD of the OG2:Fancg+/+ and OG2:Fancg−/− PGCs with or without the addition of factors to the medium (WT vs WT + factors, P = 0.0027; WT vs KO, P = 0.0005).
Figure 5
Figure 5
OG2:Fancg  −/− PGCs also exhibited increased cell speed and mean square displacement (MSD) in ex vivo E9.5 embryo culture. (A) Ex vivo migration assay of PGCs. E9.5 embryos were cultured and filmed for 8–12 h, EGFP fluorescence and diffusion light frames were captured every 15 min. (B) Movement of OG2:Fancg−/− and OG2:Fancg+/+ PGCs shown from the same origin point. (C) Average cell speed and (D) MSD of tracked PGCs from ex vivo culture of E9.5 OG2:Fancg+/+ and OG2:Fancg−/− embryos (P < 0.005).
Figure 6
Figure 6
A decreased number of PGCs was found at the front of the migrating wave in E10.5 OG2:Fancg−/− embryos. (A) Automated cell counting of PGCs using Imaris for confocal microcopy analysis of WT E10.5 cleared embryos using an antibody against EGFP to identify PGCs; the division between the ‘head’ area and the ‘tail’ area was made at the 8th somite (scale = 100 μm). (B) Ratios of PGCs found in the head and tail areas over the total number of PGCs in OG2:Fancg−/− and OG2:Fancg+/+ embryos (WT n = 6, KO n = 5). (C) Absolute number of PGCs found in the head area in E10.5 OG2:Fancg−/− and OG2:Fancg+/+ embryos (WT n = 6, KO n = 5).
Figure 7
Figure 7
Involvement of Rac1 signaling in abnormal migratory properties and loss of Fancg−/− PGCs as shown by recovery of the phenotype in the presence of the Rac1 inhibitor NSC23766. (A) Expression of RAC1 in PGCs from E10.5 OG2:Fancg+/+ male embryos. PGCs are labeled with an antibody against EGFP (green), RAC1 (red) and nucleus are stained with DAPI [blue; (scale = 10 μm)]. RAC1 expression in PGCs from E10.5 OG2:Fancg+/+ (B) and E10.5 OG2:Fancg−/− embryos (C) [scale = 5 μm]. (D) GSEA showing enrichment plots with gene set enrichment scores (ES) for Rac1. (E, F and G) In vitro migration assay of E10.5 PGCs in response to Rac1 inhibitor (acquisition over 7 h, frame every 20 min): average cell speed (E), cell trajectories shown from the same origin (F) and mean square displacement (G) of PGCs from E10.5 OG2:Fancg−/− and OG2:Fancg+/+ embryos with or without Rac1 inhibitor [MSD KO vs KO + inhib, P < 0.0001; MSD WT vs WT + inhib, P < 0.0001]. (H) Partial restoration of the loss of PGC in OG2:Fancg−/− E14.5 embryos following daily Rac1 inhibitor or PBS administration to pregnant mice from E8.5 to E10.5 (WT/HET + PBS n = 12, WT/HET + inhib n = 15, KO + PBS n = 5, KO + inhib n = 4).

References

    1. Ceccaldi, R., Sarangi, P. and D’Andrea, A.D. (2016) The Fanconi anaemia pathway: new players and new functions. Nat. Rev. Mol. Cell Biol., 17, 337–349. - PubMed
    1. Michl, J., Zimmer, J. and Tarsounas, M. (2016) Interplay between Fanconi anemia and homologous recombination pathways in genome integrity. EMBO J., 35, 909–923. - PMC - PubMed
    1. Blom, E., van de Vrugt, H.J., de Vries, Y., de Winter, J.P., Arwert, F. and Joenje, H. (2004) Multiple TPR motifs characterize the Fanconi anemia FANCG protein. DNA Repair (Amst), 3, 77–84. - PubMed
    1. Blanpain, C., Mohrin, M., Sotiropoulou, P.A. and Passegue, E. (2011) DNA-damage response in tissue-specific and cancer stem cells. Cell Stem Cell, 8, 16–29. - PubMed
    1. Haneline, L.S., Gobbett, T.A., Ramani, R., Carreau, M., Buchwald, M., Yoder, M.C. and Clapp, D.W. (1999) Loss of FancC function results in decreased hematopoietic stem cell repopulating ability. Blood, 94, 1–8. - PubMed

Publication types

Substances