. 2021 Nov;39(11):1243-1269.
doi: 10.1007/s40273-021-01065-y. Epub 2021 Aug 9.

How Much Does It Cost to Research and Develop a New Drug? A Systematic Review and Assessment

Affiliations

How Much Does It Cost to Research and Develop a New Drug? A Systematic Review and Assessment

Michael Schlander et al. Pharmacoeconomics. 2021 Nov.

Abstract

Background: Debate over the viability of the current commercial research and development (R&D) model is ongoing. A controversial theme is the cost of bringing a new molecular entity (NME) to market.

Objective: Our aim was to evaluate the range and suitability of published R&D cost estimates as to the degree to which they represent the actual costs of industry.

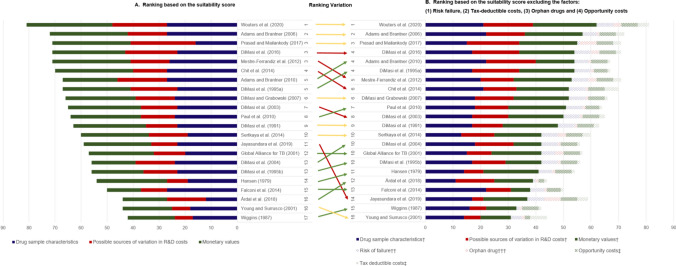
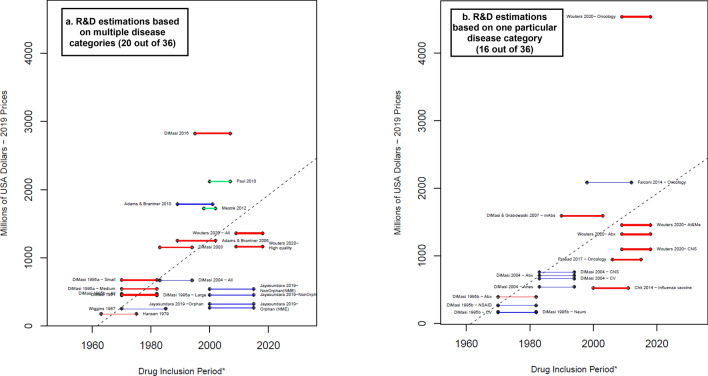
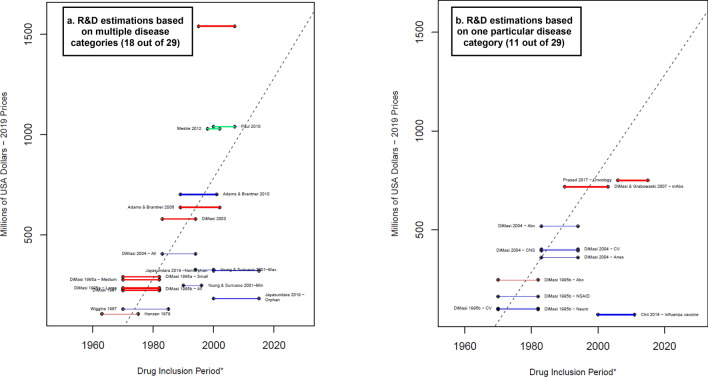
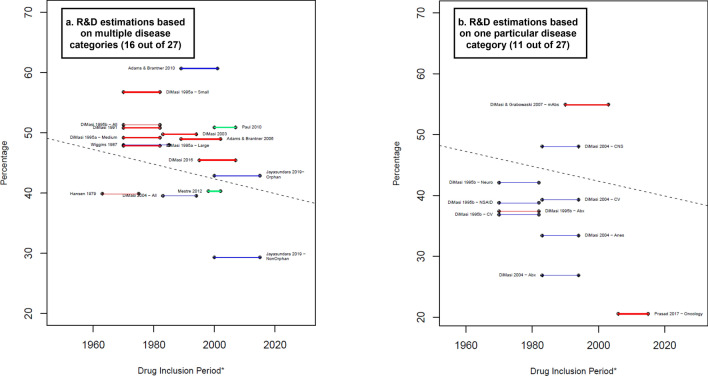
Methods: We provided a systematic literature review based on articles found in the Pubmed, Embase and EconLit electronic databases, and in a previously published review. Articles published before March 2020 that estimated the total R&D costs were included (22 articles with 45 unique cost estimates). We included only literature in which the methods used to collect the information and to estimate the R&D costs were clearly described; therefore, three reports were excluded. We extracted average pre-launch R&D costs per NME and converted the values to 2019 US dollars (US$) using the gross domestic product (GDP) price deflator. We appraised the suitability of the R&D estimated costs by using a scoring system that captures three domains: (1) how success rates and development time used for cost estimation were obtained; (2) whether the study considered potential sources contributing to the variation in R&D costs; and (3) what the components of the cost estimation were.

Results: Estimates of total average capitalized pre-launch R&D costs varied widely, ranging from $161 million to $4.54 billion (2019 US$). Therapeutic area-specific estimates were highest for anticancer drugs (between $944 million and $4.54 billion). Our analysis identified a trend of increasing R&D costs per NME over time but did not reveal a relation between cost estimates and study ranking when the suitability scores were assessed. We found no evidence of an increase in suitability scores over time.

Conclusion: There is no universally correct answer regarding how much it costs, on average, to research and develop an NME. Future studies should explicitly address previously neglected variables, which likely explain some variability in estimates, and consider the trade-off between the transparency and public accessibility of data and their specificity. Use of our proposed suitability scoring system may assist in addressing such issues.


Conflict of interest statement

Michael Schlander, Karla Hernandez-Villafuerte, Chih-Yuan Cheng, Jorge Mestre-Ferrandiz, and Michael Baumann have no conflicts of interest to report.

Figures

Fig. 1.
Fig. 1.
Article ranking based on the total suitability scores of the R&D cost estimation. † Excluding the factor(s) that is (are) plotted separately. †† Part of the “Drug sample characteristic group”. ††† Part of the “Possible sources of variation in R&D costs group”. ‡ Part of the “Monetary values group”. The number next to the reference represents the ranking of the estimation in accordance with the value of the suitability score. Estimations that share the same suitability score have the same ranking. Source: Authors’ elaboration
Fig. 2.
Fig. 2.
Average capitalized R&D costs estimated per successful drug (considering failures)—total. Blue lines: R&D costs estimation for the clinical phases. Red lines: R&D costs estimations that include an approximation for the discovery and preclinical phases. Green lines: R&D costs estimations that include an approximation for the discovery and preclinical phases as well as the R&D during the period of submission for market approval. * A thicker line represents a higher value in the suitability score, thus higher suitability of the R&D cost estimation. The length of the lines corresponds to the drug inclusion period. This is the time period considered by the authors for the selection of the drug sample. In most articles, it is the period in which the drug was first tested in humans. Nevertheless, some authors applied different definitions. For more details, see electronic supplementary information 2. Dashed line: OLS regression (excluding Jayasundara et al. [40], Chit et al. [45], and Wouters et al. [19]— Oncology): R&Dcosts=-64,480.30(p-value=0.0)+32.87(p-value=0.0)Year. Year corresponds to the middle point of the drug inclusion period, additional details in electronic supplementary information 6. Abx anti-infectives, All the estimation includes all the observations in the sample, Anes analgesics/anesthetic, CNS central nervous system, CV cardiovascular, At&Me metabolism and endocrinology, Large large enterprises, mAbs monoclonal antibodies, Max maximum reported value, Medium medium enterprises, Min minimum reported value, Neuro neuropharmacological, NSAID nonsteroidal anti-inflammatory drugs, Small small enterprises, TB tuberculosis. Note: (1) Each line corresponds to one main R&D estimate. When more than one R&D cost estimate is reported, we refer to each by including the reference of the corresponding article and a keyword that describes the main characteristic of the R&D cost estimate. Wouters et al. [19] categorized each selected data point as high, medium, or low quality, depending on the availability and consistency of reported data. ‘High quality’ corresponds only to the estimations considered high quality observations. (2) With the exception of Falconi et al. [50], all the R&D values are capitalized until market approval. (3) DiMasi and Grabowski [53] also considered therapeutic recombinant proteins. Source: Authors’ elaboration
Fig. 3.
Fig. 3.
Average cash spent on R&D estimated per successful drug (considering failures)—total. Blue lines R&D costs estimation for the clinical phases. Red lines: R&D costs estimation that include an estimation for the discovery and preclinical phases. Green lines: R&D costs estimations that include an estimation for the discovery and preclinical phases as well as the R&D during the period of submission for market approval. * A thicker line represents a higher value in the suitability score, thus higher suitability of the R&D cost estimation. The length of the lines corresponds to the drug inclusion period. This is the time period considered by the authors for the selection of the drug sample. In most articles, it is the period in which the drug was first tested in humans. Nevertheless, some authors applied different definitions. For more details, see electronic supplementary information 2. Dashed line: OLS regression (excluding Jayasundara et al. [40], Chit et al. [45], and Wouters et al. [19]—oncology): R&Dcosts=-49,122.78(p-value=0.0)+24.95(p-value=0.0)Year. Year corresponds to the middle point of the drug inclusion period, additional details in electronic supplementary information 6. Abx anti-infectives, All the estimation includes all the observations in the sample, Anes analgesics/anesthetic, CNS central nervous system, CV cardiovascular, At&Me metabolism and endocrinology, Large large enterprises, mAbs monoclonal antibodies, Max maximum reported value, Medium medium enterprises, Min minimum reported value, Neuro neuropharmacological, NSAID nonsteroidal anti-inflammatory drugs, Small small enterprises, TB tuberculosis. Note: (1) Each line corresponds to one main R&D estimate. When more than one R&D cost estimate is reported, we refer to each by including the reference of the corresponding article and a keyword that describes the main characteristic of the R&D cost estimate. Wouters et al. [19] categorized each selected data point as high, medium, or low quality, depending on the availability and consistency of reported data. ‘High quality’ corresponds only to the estimations considered high quality observations. (2) Young and Surrusco [24] methodology included the period of submission (R&D spending over 7-years and drugs approved during the preceding 7-years). However, it did not consider the discovery and preclinical phases; therefore, it is presented as a blue line. (3) DiMasi and Grabowski [53] also considered therapeutic recombinant proteins. Source: Authors’ elaboration
Fig. 4.
Fig. 4.
Costs of time as proportion of the average capitalized R&D costs. Blue lines: R&D costs estimation for the clinical phases. Red lines: R&D costs estimations that include an approximation for the discovery and preclinical phases. Green lines: R&D costs estimations that include an approximation for the discovery and preclinical phases as well as the R&D during the period of submission of market approval. Percentage that the costs related to time represents equal to: (AveragecapitalizedR&D costs per successful drug-Averagecashspent in R&D per successful drug)AveragecapitalizedR&D costs per successful drug. * A thicker line represents a higher value in the suitability score, thus higher suitability of the R&D cost estimation. The length of the lines corresponds to the drug inclusion period. Dashed line: OLS regression (excluding Jayasundara et al. [40], Chit et al. [45], and Wouters et al. [19] for Oncology): R&Dcosts=397.97p-value=0.2-0.18(p-value=0.2)Year. Year corresponds to the middle point of the drug inclusion period, additional details in electronic supplementary information 6. Abx anti-infectives, All the estimation includes all the observations in the sample, Anes analgesics/anesthetic, CNS central nervous system, CV cardiovascular, At&Me metabolism and endocrinology, Large large enterprises, mAbs monoclonal antibodies, Max maximum reported value, Medium medium enterprises, Min minimum reported value, Neuro neuropharmacological, NSAID nonsteroidal anti-inflammatory drugs, Small small enterprises, TB tuberculosis. Note: (1) Each line corresponds to one main R&D estimate. When more than one R&D costs estimate is reported, we refer to each by including the reference of the corresponding article and a keyword that describes the main characteristic of the R&D costs estimate. Wouters et al. [19] categorized each selected data point as high, medium, or low quality, depending on the availability and consistency of reported data. "High-quality" corresponds to the estimation considered only high-quality observations. (2) The drug inclusion period corresponds to the time period considered by the authors for the selection of the drug sample. In most articles, it is the period in which the drug was first tested in humans. Nevertheless, some authors applied different definitions. For more details, see electronic supplementary information 2. (3) DiMasi and Grabowski [53] also considered therapeutic recombinant proteins. (3) Chit et al. [45] was excluded from this figure because their capitalized cost estimation was reported in 2022 Canadian dollars, for which we do not have a proper method to deflate to 2019 values. Source: Authors’ elaboration.

References

    1. Pammolli F, Magazzini L, Riccaboni M. The productivity crisis in pharmaceutical R&D. Nat Rev Drug Discov. 2011;10(6):428. - PubMed
    1. Barker R. A flexible blueprint for the future of drug development. Lancet. 2010;375(9712):357–359. - PubMed
    1. Gambardella A, Orsenigo L, Pammolli F, Lacetera N, Magazzini L, Mariani M, et al. Global competitiveness in pharmaceuticals: a European perspective. Brussels: European Commission; 2000.
    1. Backfisch M. Have pharmaceutical R&D project success rates decreased? A critical review and new empirical results. In Joint discussion paper series in economics. 2017.
    1. Pammolli F, Righetto L, Abrignani S, Pani L, Pelicci PG, Rabosio E. The endless frontier? The recent upsurge of R&D productivity in pharmaceuticals. BioRxiv:2019:670471. - PMC - PubMed

Publication types

Substances