. 2022 Jun;17(6):677-694.
doi: 10.1080/15592294.2021.1952375. Epub 2021 Aug 9.

Disentangling tumorigenesis-associated DNA methylation changes in colorectal tissues from those associated with ageing

Affiliations

Disentangling tumorigenesis-associated DNA methylation changes in colorectal tissues from those associated with ageing

Stephany Orjuela et al. Epigenetics. 2022 Jun.

Abstract

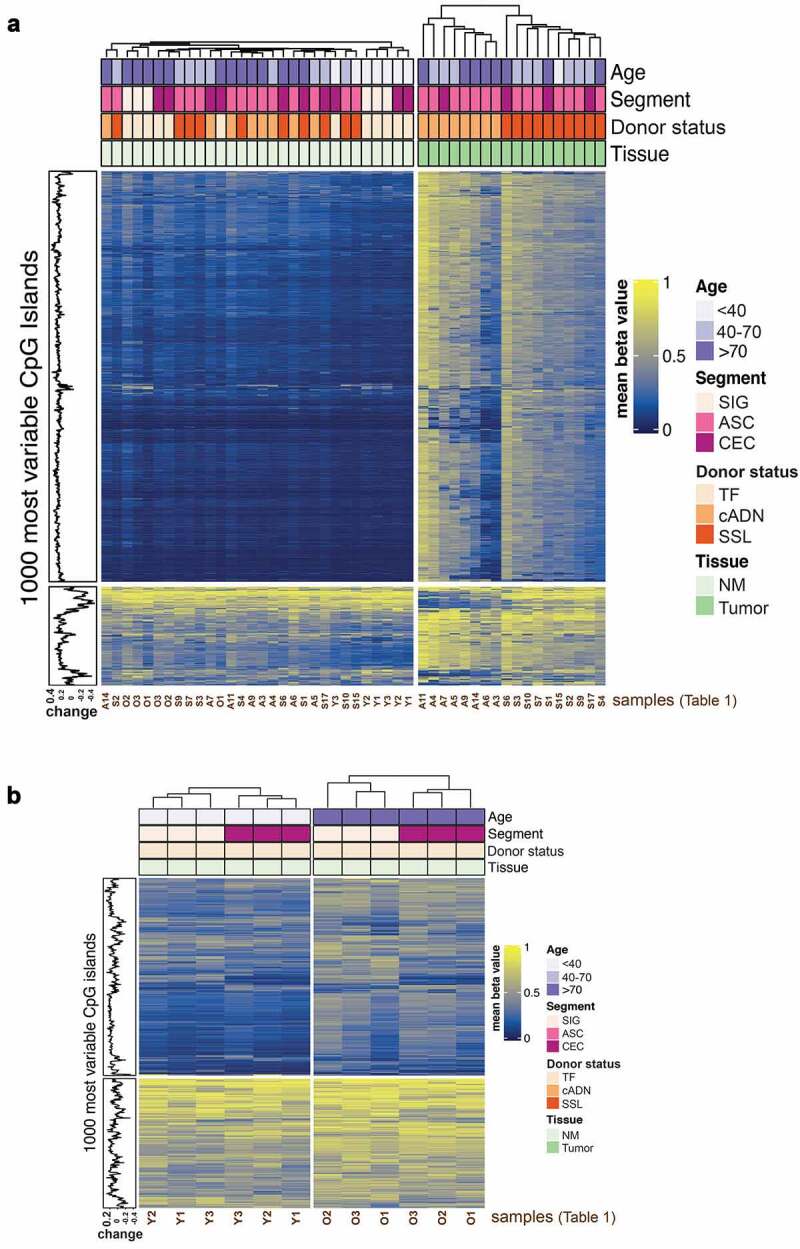
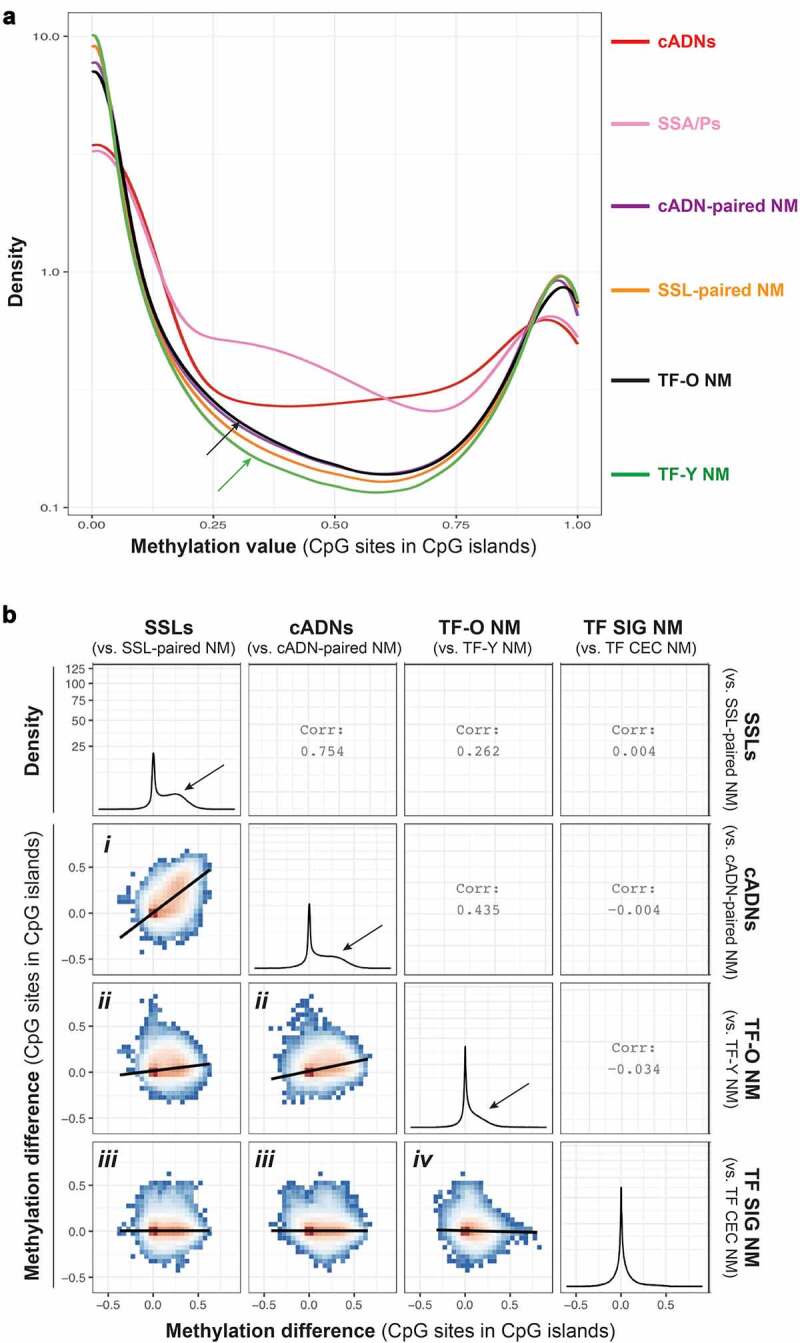
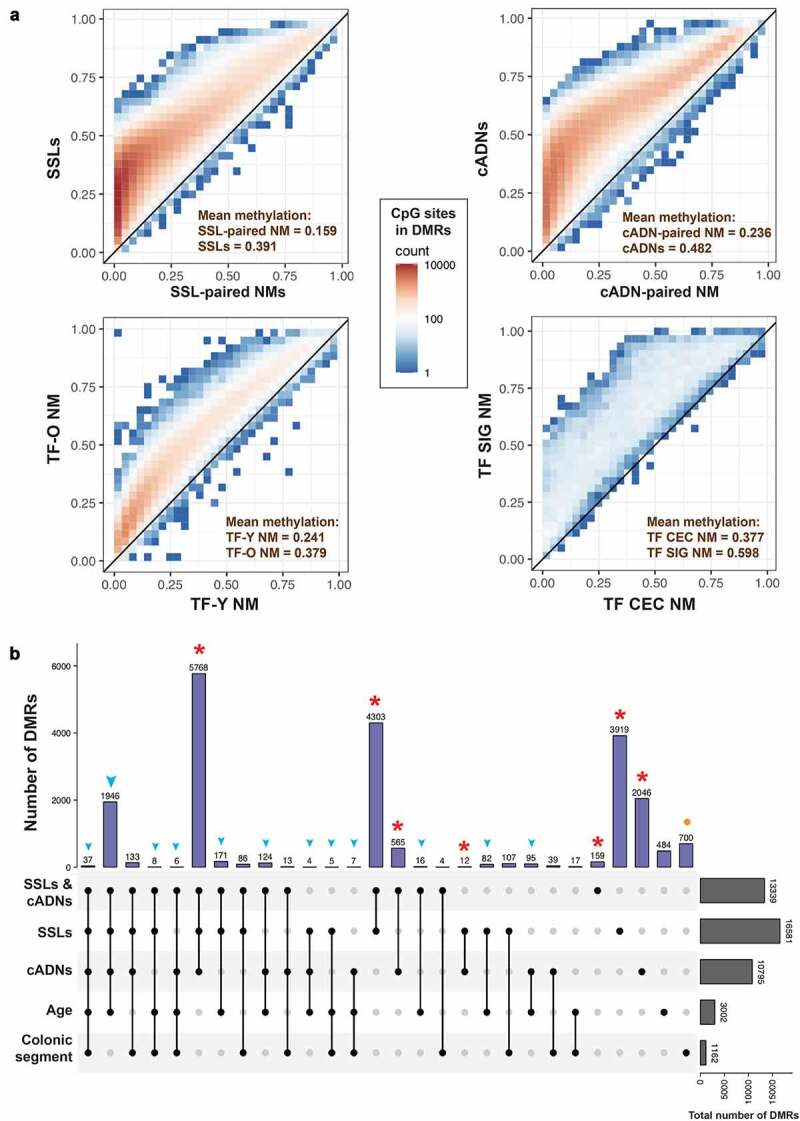
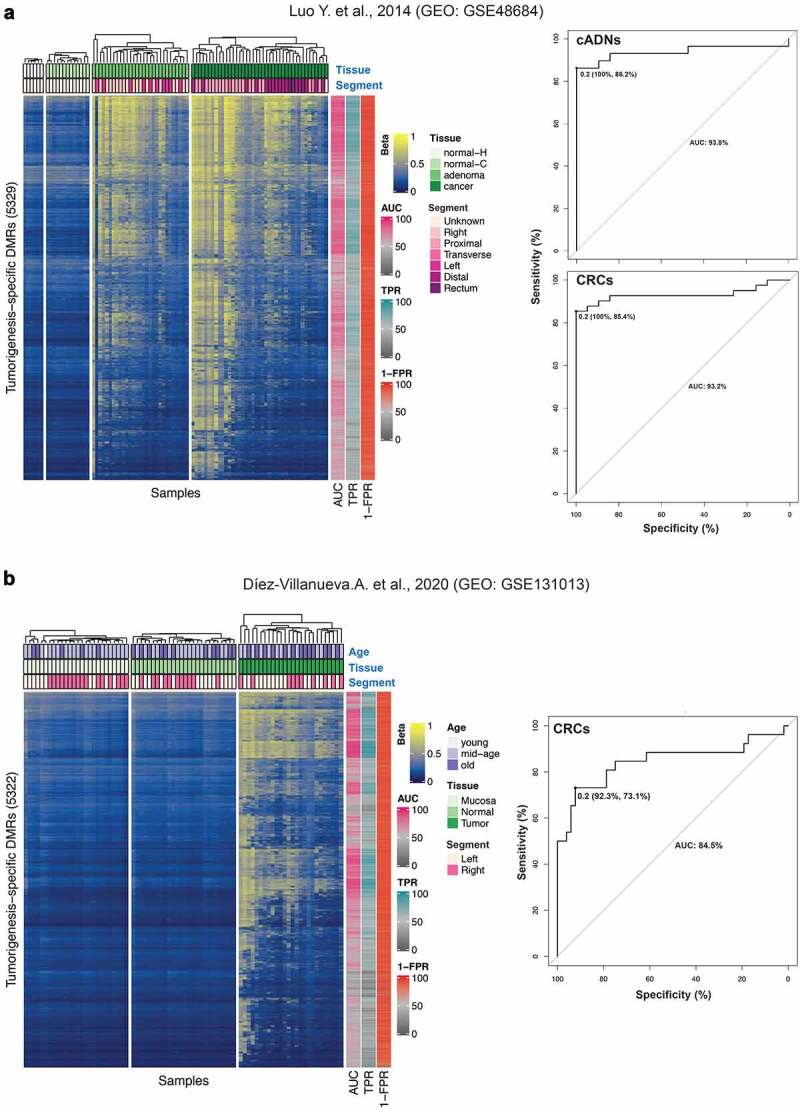
Physiological ageing and tumorigenesis are both associated with epigenomic alterations in human tissue cells, the most extensively investigated of which entails de novo cytosine methylation (i.e., hypermethylation) within the CpG dinucleotides of CpG islands. Genomic regions that become hypermethylated during tumorigenesis are generally believed to overlap regions that acquire methylation in normal tissues as an effect of ageing. To define the extension of this overlap, we analysed the DNA methylomes of 48 large-bowel tissue samples taken from women of different ages during screening colonoscopy: 18 paired samples of normal and lesional tissues from donors harbouring a precancerous lesion and 12 samples of normal mucosa from tumour-free donors. Each sample was subjected to targeted, genome-wide bisulphite sequencing of ~2.5% of the genome, including all CpG islands. In terms of both its magnitude and extension along the chromatin, tumour-associated DNA hypermethylation in these regions was much more conspicuous than that observed in the normal mucosal samples from older (vs. younger) tumour-free donors. 83% of the ageing-associated hypermethylated regions (n = 2501) coincided with hypermethylated regions observed in tumour samples. However, 86% of the regions displaying hypermethylation in precancerous lesions (n = 16,772) showed no methylation changes in the ageing normal mucosa. The tumour-specificity of this latter hypermethylation was validated using published sets of data on DNA methylation in normal and neoplastic colon tissues. This extensive set of genomic regions displaying tumour-specific hypermethylation represents a rich vein of putative biomarkers for the early, non-invasive detection of colorectal tumours in women of all ages.

Keywords: DNA methylation; ageing; colorectal adenoma; colorectal cancer; differentially methylated region; normal colorectal mucosa; sessile serrated lesion.


Conflict of interest statement

The authors declare that they have no competing interests.

Figures

Figure 1.
Figure 1.
Methylomes of the colorectal tissues analysed. Unsupervised hierarchical clustering was performed based on the methylation status of the 1000 CpG islands displaying the highest variability in the tissues analysed: 18 precancerous tumours from the proximal colon (10 SSLs, 8 cADNs) and 30 NM samples (18 from the SSL or cADN donors, 12 from TF donors). a. Heatmap of all 48 samples. In both precancerous tumour types, the 1000 CpG islands considered are far more methylated than in any of the four groups of NM samples. SSLs and cADNs can also be distinguished from one other. b. Heatmap of the 12 NM samples from TF donors (1 CEC + 1 SIG per donor). Hierarchical clustering was performed within each age group. The CpG islands were more highly methylated in samples from TF donors >70 (TF-O NM) than in those from younger (<40y) TF donors (TF-Y NM). In both age groups, caecal and sigmoid NM samples (TF NMCEC and TF NMSIG) could also be distinguished. Abbreviations: ASC, ascending colon; cADN, conventional adenoma; CEC, caecum; NM, normal mucosa; O, older; SSL, sessile serrated lesion; SIG, sigmoid colon; TF, tumour-free; Y, younger.
Figure 2.
Figure 2.
The CpG island hypermethylation phenotype in tumours and ageing NM. a. Density plot showing the methylation value at CpG sites within CpG islands in tumours (cADNs and SSLs) and in NM samples from cADN donors, SSL donors, older (>70) TF donors (TF-O), and younger (<40) TF donors (TF-Y). Methylation levels in each tumour type clearly exceed levels in any of the four classes of NM. Levels in TF-O NM (black arrow) were only slightly higher than those in TF-Y NM (green arrow). Methylation values were calculated for the 1,060,602 CpG sites remaining after the exclusion of sites displaying 0 methylation in all tissue samples. The y-axis was log10-transformed. b. Six ggpairs plots comparing the methylation changes identified in tumours (i.e., methylation difference between SSLs, or cADNs, and matched samples of NM) with those associated with NM ageing (NM samples from TF donors >70 vs. TF donors <40) and with changes associated with the anatomical location of the NM sample of TF donors (SIG vs. CEC). Methylation difference on axes refers to the methylation proportions change, as defined by dmrseq (see Methods). Methylation differences were calculated for 653,484 CpG sites in CpG islands. Colours in ggpairs plots represent the density of points per square, e.g., red bins contain the highest density of points. Regression lines are drawn over each ggpairs plot. Numbers in empty quadrants correspond to the Pearson correlations (Corr) of each ggpairs plot. As for the four density plots, the y-axis was square root-transformed. Black arrows in these plots indicate the magnitude of hypermethylation in tumours and in the TF-O NM samples. (Abbreviations as defined in Figure 1.).
Figure 3.
Figure 3.
Hypermethylated differentially methylated regions (DMRs) related to early colorectal tumorigenesis, normal mucosa ageing, and/or anatomical location of normal mucosa. a. Scatter plots showing the number of methylated CpG sites within the identified hypermethylated DMRs (colour gradient) and mean methylation levels at these sites in precancerous tumours (SSLs or cADNs) versus SSL-paired NM and cADN-paired NM, respectively; in TF-O NM samples vs. TF-Y NM samples; and in TF SIG NM vs. TF CEC NM. b. UpSet plot showing the tumorigenesis-, ageing-, and colon segment-specificities of the hypermethylated DMRs. The vast majority of the hypermethylated DMRs in tumours (in SSLs, cADNs, or both, red asterisks) were tumorigenesis-specific, i.e., regions that displayed no ageing-related or colon segment-related changes in the NM. In contrast, over 80% of the ageing-associated DMRs overlapped tumorigenesis-associated DMRs (blue arrowheads). Most regions that were differentially methylated in SIG vs. CEC NM samples displayed no methylation alterations associated with ageing or tumorigenesis (orange dots). (Abbreviations as defined in Figure 1.).
Figure 4.
Figure 4.
Validation of our tumorigenesis-specific hypermethylated DMRs. Findings were validated against publicly accessible Illumina 450 K microarray datasets. a. The GEO dataset GSE48684 published by Luo et al. [72]. Left: Heatmap of the 89 female colorectal tissue samples included in the dataset. Each row corresponds to one of our tumorigenesis-specific hypermethylated DMRs containing at least 1 of the Illumina microarray probes (total: 5329 of the 5521 hypermethylated DMRs we classified as highly tumorigenesis-specific; see Results). The beta value (from 0, blue, to 1, yellow) reported for each DMR is the average beta across all the microarray probes within our tumorigenesis-specific DMR coordinates (details in the Methods section). Our tumorigenesis-specific DMRs displayed hypermethylation in the tumours (vs. normal mucosa) studied by Luo et al. Metadata available for the GSE48684 dataset includes tissue (normal-H: normal mucosa samples from patients with no history of CRC; normal-C: normal mucosa samples from patients with concurrent CRC; adenoma: cADN; cancer: CRC) and colon segment (Right, Proximal and Transverse: proximal colon; Left and Distal: distal colon). Donor ages were not reported. Right: ROC curves showing the high accuracy of tumour classification as cADN (AUC: 93.8%) or CRC (AUC: 93.2%) based on the median of DMR beta values (optimal cut-off: 0.2; specificity 100%, sensitivity 86.2% for cADNs; specificity 100%, sensitivity 85.4% for CRCs) as described in the Methods section. AUC, sensitivity (TPR) and specificity (1-FPR) for each tumorigenesis-specific DMR are also shown (colour annotation on the right side of the heatmap). b. The GEO GSE131013 dataset published by Díez-Villanueva et al. [73]. Left. Heatmap of the 78 female colorectal tissue samples in this dataset based on the beta values for 5322 of our highly tumorigenesis-specific hypermethylated DMRs (as described for panel A). Our tumorigenesis-specific DMRs displayed hypermethylation in the tumours (vs. normal mucosa) studied by Díez-Villanueva et al. Metadata available for the Díez-Villanueva dataset includes age (young: <40 [1 donor]; middle-age: 40–70, 48 women; old: >70, 29 women), tissue (Mucosa, normal mucosa sample from healthy donors; Normal, normal mucosa sample adjacent to CRC; Tumour, CRC) and colon segment (Left, distal colon; Right, proximal colon). Right: ROC curve analysis of the accuracy of the median of DMR beta values (optimal cut-off 0.2; specificity 92.3%, sensitivity 73.1%) in predicting tissue type (correct classification of CRC – AUC: 84.5%). AUC, sensitivity (TPR) and specificity (1-FPR) for each tumorigenesis-specific DMR are also shown (colour annotation on the right side of the heatmap).

References

    1. Arndt V, Feller A, Hauri D, et al. Swiss cancer report 2015. Neuchatel, Switzerland: Federal Statistical Office; 2016;
    1. Winawer SJ. Natural history of colorectal cancer. Am J Medicine. 1999;106:3–6. - PubMed
    1. Lash RH, Genta RM, Schuler CM.. Sessile serrated adenomas: prevalence of dysplasia and carcinoma in 2139 patients. J Clin Pathol. 2010;63:681. - PubMed
    1. Hassan C, Quintero E, Dumonceau J-M, et al. Post-polypectomy colonoscopy surveillance: European Society of Gastrointestinal Endoscopy (ESGE) Guideline. Endoscopy. 2013;45:842–864. - PubMed
    1. Carr PR, Weigl K, Edelmann D, et al. Estimation of absolute risk of colorectal cancer based on healthy lifestyle, genetic risk, and colonoscopy status in a population-based study. Gastroenterology. 2020;159:129–138.e9. - PMC - PubMed

Publication types

Substances