. 2022 Jun-Jul;17(7):786-807.
doi: 10.1080/15592294.2021.1959742. Epub 2021 Aug 9.

Chromatin and transcriptomic profiling uncover dysregulation of the Tip60 HAT/HDAC2 epigenomic landscape in the neurodegenerative brain

Affiliations

Chromatin and transcriptomic profiling uncover dysregulation of the Tip60 HAT/HDAC2 epigenomic landscape in the neurodegenerative brain

Mariah Beaver et al. Epigenetics. 2022 Jun-Jul.

Abstract

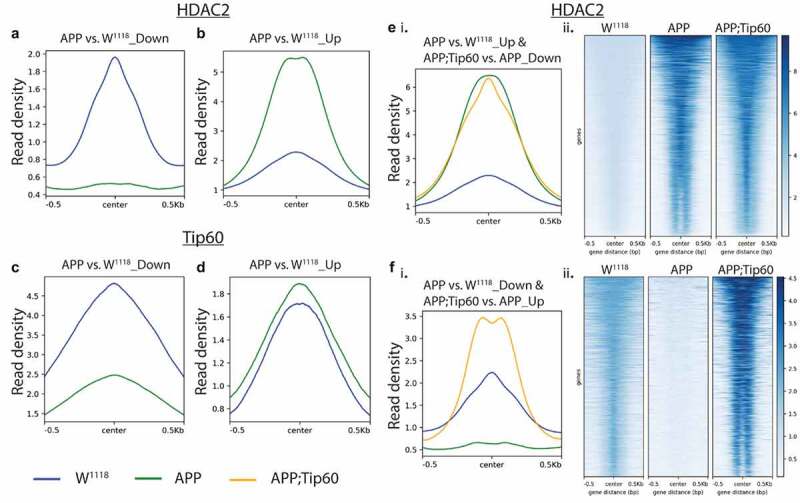
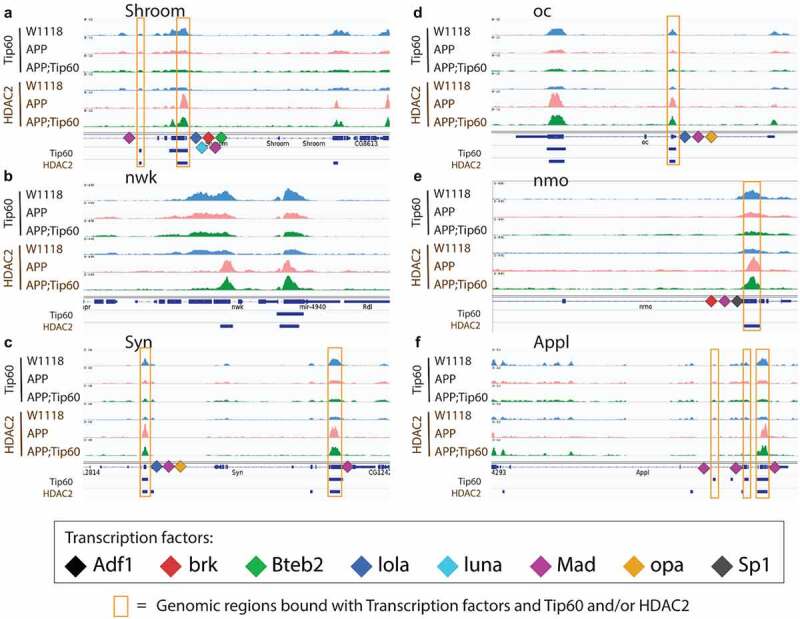
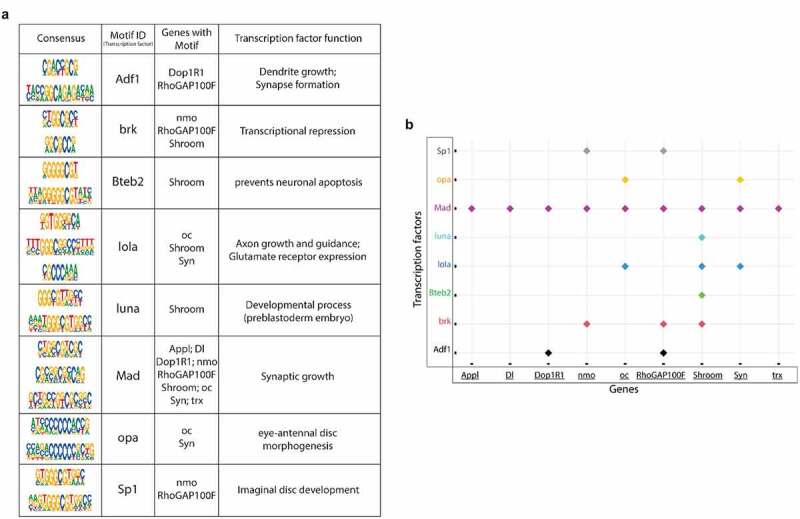
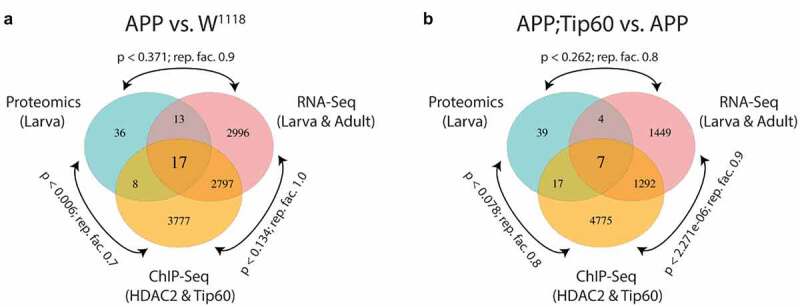
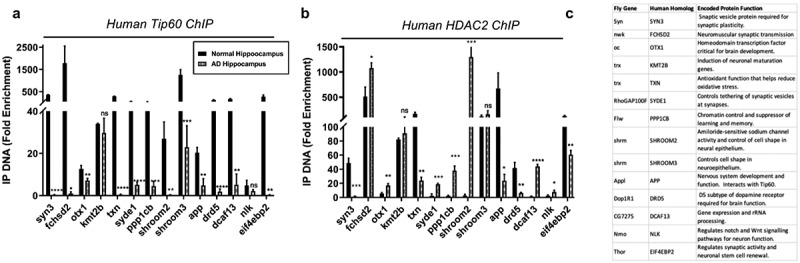
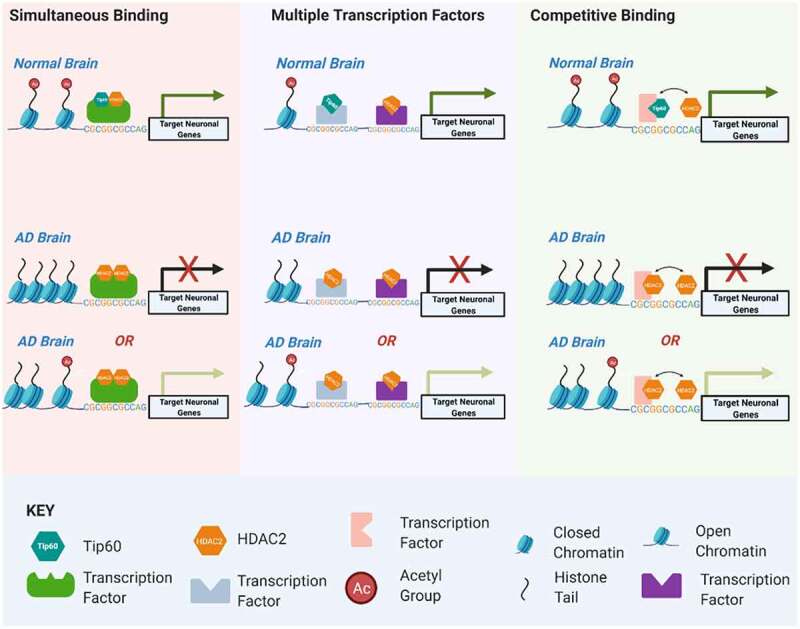
Disruption of histone acetylation-mediated gene control is a critical step in Alzheimer's Disease (AD), yet chromatin analysis of antagonistic histone acetyltransferases (HATs) and histone deacetylases (HDACs) causing these alterations remains uncharacterized. We report the first Tip60 HAT versus HDAC2 chromatin (ChIP-seq) and transcriptional (RNA-seq) profiling study in Drosophila melanogaster brains that model early human AD. We find Tip60 and HDAC2 predominantly recruited to identical neuronal genes. Moreover, AD brains exhibit robust genome-wide early alterations that include enhanced HDAC2 and reduced Tip60 binding and transcriptional dysregulation. Orthologous human genes to co-Tip60/HDAC2 D. melanogaster neural targets exhibit conserved disruption patterns in AD patient hippocampi. Notably, we discovered distinct transcription factor binding sites close or within Tip60/HDAC2 co-peaks in neuronal genes, implicating them in coenzyme recruitment. Increased Tip60 protects against transcriptional dysregulation and enhanced HDAC2 enrichment genome-wide. We advocate Tip60 HAT/HDAC2 mediated epigenetic neuronal gene disruption as a genome-wide initial causal event in AD.

Keywords: Alzheimer’s disease; Amyloid precursor protein; KAT5; histone acetylation; sequencing.


Conflict of interest statement

No potential conflict of interest was reported by the author(s).

Figures

Figure 1.
Figure 1.
Diffuse amyloid deposits are abundant in the mushroom body (MB) in seven-day-old APP adults but not in third-instar APP larvae. (a) Representative images. Aβ deposits were stained with anti-Aβ42 antibody (green). Nuclei were stained with PI (red). The Kenyon (Kn) cell region (boxed) was zoomed in to display Kn cells and Aβ deposits. (i) Immunostaining of brains of third-instar larvae shows a negligible Aβ42 signal in APP flies compared to no Aβ42 signal in w1118 flies. (ii) Immunostaining of brains of seven-day-old adults shows evident Aβ deposits in APP flies compared to w1118 flies. Arrowheads indicate Aβ deposits. No Aβ42 signal was detected in the Calyx (Ca) region. Scale bar represents 100 μm. (b) Aβ deposits were quantified by both number and size. (i) Quantification of Aβ deposit numbers and areas in the third-instar larval brain Kn region. n = 9 ~ 10. (ii) Quantification of Aβ deposit numbers and area in the seven-day-old adult brain Kn region. n = 8 ~ 9. **p < 0.01; unpaired student’s t-test. All data are shown as mean ± SEM.
Figure 2.
Figure 2.
Tip60 protects against early (third-instar larval) and late (seven-day-old adult) transcriptomic deregulation in the APP AD-associated neurodegenerative brain. (a) Log2 fold changes of differentially expressed genes (padj ≤0.05 and log2FoldChange of ≤-0.583 and ≥0.583) determined by RNA-seq in the third-instar larval and adult heads in APP vs. w1118 and APP;Tip60 vs. APP. Changes were prominent in both third-instar larval and adult APP heads, while Tip60-induced changes initiated in the third-instar larval head and were prominent in the adult head: indicating the effect of Tip60 over time. (b and c) The upSet plot represents the distribution and intersection of down and up-regulated genes between APP vs. w1118 and APP;Tip60 vs. APP in third-instar larval (b) and adult (c) heads. Rows represent the number of genes in each comparison (APP vs. w1118 and APP;Tip60 vs. APP), and columns represent the number of genes per interaction. The red and blue bars represent the up and down-regulated genes, respectively. The black filled dots indicate the association between rows. The red and blue columns represent genes uniquely up-regulated and down-regulated genes, respectively, in given comparisons, while the purple columns represent Tip60 reprogrammed genes.
Figure 3.
Figure 3.
Heatmaps depicting the relative expression pattern of genes misregulated in APP larval and adult heads and are rescued by Tip60. Representation of genes from the most representative biological processes in the top 25 pathways enriched from the rescue gene list. (a) Heatmap of genes representing the cell-cycle regulation processes and RNA metabolic processes in the third instar larval head. Heatmap of genes representing the lipid metabolic pathways in the (b) third-instar larval head and (c) the adult head. (d) Heatmap of genes representing the axon and dendrite related pathways in the adult head. Log-transformed gene expression values are displayed as colours ranging from red to blue, as shown in the key. Red represents an increase in gene expression, while blue represents a decrease in expression.
Figure 4.
Figure 4.
Increased Tip60 protects against enhanced HDAC2 enrichment in APP larval heads. (a) Log2 fold changes of differentially bound peaks (padj ≤0.05) of HDAC2 and Tip60 in APP vs. w1118 and APP;Tip60 vs. APP. APP-induced changes (APP vs. w1118) were prominent in both HDAC2 and Tip60 samples, while Tip60-induced changes (APP;Tip60 vs. APP) were prominent only in HDAC2 samples. (b and c) The upSet plot represents the distribution and intersection of differentially bound peaks between APP vs. w1118 and APP;Tip60 vs. APP from HDAC2 (b) and Tip60 (c) samples. Rows represent the number of peaks in each comparison (APP vs. w1118 and APP;Tip60 vs. APP), and columns represent the number of peaks per interaction. The red and blue bars represent the increased and decreased binding of HDAC2 or Tip60, respectively. The black filled dots indicate the association between rows. The red and blue columns represent peaks unique to a given comparison, while the purple columns represent the peaks rescued by Tip60 expression.
Figure 5.
Figure 5.
Tip60 expression protected against alterations in the HDAC2 binding pattern along the gene body in APP larval heads. (a and b) Profile plots representing decreased (a) and increased (b) binding of HDAC2 in APP larval heads. (c and d) Profile plots representing the decreased (c) and increased (d) binding of Tip60 in APP larval heads. Profile plots also represent the significant increase in HDAC2 binding (B) and decrease in Tip60 binding (C) in APP larval heads. (Ei. and Fi.) Profile plots representing the rescue effect (reversal in APP-induced binding pattern) of Tip60 expression on HDAC2 binding. (E ii. and F ii.) The corresponding heatmaps represent the Tip60 rescue effect. Sequencing data centred + /- 0.5 kilobase from the centre region of the gene body.
Figure 6.
Figure 6.
Tip60 and HDAC2 bind at similar genomic coordinates and co-regulate synaptic plasticity and neuronal developmental process-related genes. (a-f) The figure depicts the genome browser track view of high resolution Tip60 and HDAC2 peak analysis in three genotypes (w1118, APP, and APP;Tip60) at the following genes that were identified to functionally modify neurodegeneration in the GMR-tau eye screen: Shroom (a), nwk (b), Syn (c), oc (d), nmo (e), and Appl (f) loci. The orange box highlights the blue bars below the gene features panel depicting the location of genomic region peaks bound by both Tip60 and HDAC2. These co-Tip60/HDAC2 bound peaks also contain consensus binding motifs for the following transcription factors: Adf1, brk, Bteb2, lola, luna, Mad, opa, and Sp1).
Figure 7.
Figure 7.
Transcription factor (TF) motifs significantly enriched within the rescue gene list and the associated Tip60/HDAC2 AD genes. TF motifs were identified using the MEME-Chip platform (CentriMo). (a) Consensus sequences and their corresponding TFs bound and the associated Tip60/HDAC2 AD genes. (b) Plot representing the association of Tip60/HDAC2 AD genes and the TFs.
Figure 8.
Figure 8.
RNA-seq, ChIP-seq, and mass spectrometry data convey the integrative and independent gene expression regulation induced by APP and Tip60 expression. (a and b) Venn diagram of differentially regulated genes in the third instar larval and adult heads (RNA-seq), genes with differentially binding of Tip60 and HDAC2 in the third instar larval heads (ChIP-seq), and differentially regulated proteins in the third instar larval heads (mass spectrometry) from (a) APP vs. w1118 comparison and (b) APP;Tip60 vs. APP comparison. A representation factor (rep. fact.) >1 indicates more overlap than expected of two independent groups, a representation factor <1 indicates less overlap than expected, and a representation factor of 1 indicates that the two groups by the number of genes expected for independent groups of genes. A p value <0.05 is considered significant.
Figure 9.
Figure 9.
Human homologs of co-Tip60/HDAC2 D. melanogaster neural gene targets exhibit conserved Tip60 and HDAC2 binding patterns in normal versus AD patient hippocampi. Chromatin was isolated from healthy control and AD hippocampus (n = 3 brains per condition). Histograms represent ChIP enrichment using the EZ-Magna ChIP Kit (Millipore, MA, USA) with antibodies to (a) Tip60 and (b) HDAC2. For each ChIP experiment a control reaction containing mouse IgG polyclonal antibodies was performed simultaneously. Real-time PCR was performed on DNA purified from each of the ChIP reactions using primer pairs specific for each gene loci. Fold enrichment of the respective genes was calculated relative to the IgG control using the standard curve method as described by the EZ-Magna ChIP Kit manual. Statistical significance was calculated using unpaired Student’s t test. *p < 0.05, **p < 0.01, ***p < 0.001, ****p < 0.0001. Error bars indicate SEM. (See S12 Table for primer sequences) (c) Table depicting D. melanogaster and human homolog gene names and conserved gene functions.
Figure 10.
Figure 10.
Model for Tip60 and HDAC2 co-mediated neuronal gene control. Our results support a model by which transcription factors (TFs) within a given neuronal gene body serve as docking sites for recruitment of both HDAC2 and Tip60 either simultaneously to the same TF, separately to multiple TFs within close proximity to one another or competitively to a given TF. We speculate these scenarios are not mutually exclusive of one another and may explain the rapid histone acetylation changes within activity-dependent neural genes that drive their swiftly fluctuating transcriptional responses. Early disruption of Tip60/HDAC homoeostasis in the AD brain promotes enhanced HDAC2 recruitment over Tip60 that may be initiated at co-Tip60/HDAC2 docking sites and causes inappropriate up or down regulation of target genes. We speculate these deleterious changes in gene expression persist and worsen during AD progression.

References

    1. Sanchez-Mut JV, Graff J.. Epigenetic alterations in Alzheimer’s disease. Front Behav Neurosci. 2015;9:347. - PMC - PubMed
    1. Masters CL, Bateman R, Blennow K, et al. Alzheimer’s disease. Nat Rev Dis Primers. 2015;1(1):15056. - PubMed
    1. Karch CM, Cruchaga C, Goate AM.. Alzheimer’s disease genetics: from the bench to the clinic. Neuron. 2014;83(1):11–26. - PMC - PubMed
    1. Saha RN, Pahan K. HATs and HDACs in neurodegeneration: a tale of disconcerted acetylation homeostasis. Cell Death Differ. 2006;13(4):539–550. - PMC - PubMed
    1. Berson A, Nativio R, Berger SL, et al. Epigenetic regulation in neurodegenerative diseases. Trends Neurosci. 2018;41(9):587–598. - PMC - PubMed

Publication types