. 2021 Aug 9;6(15):e145991.
doi: 10.1172/jci.insight.145991.

Antisense oligonucleotide treatment rescues UBE3A expression and multiple phenotypes of an Angelman syndrome mouse model

Affiliations

Antisense oligonucleotide treatment rescues UBE3A expression and multiple phenotypes of an Angelman syndrome mouse model

Claudia Milazzo et al. JCI Insight. .

Abstract

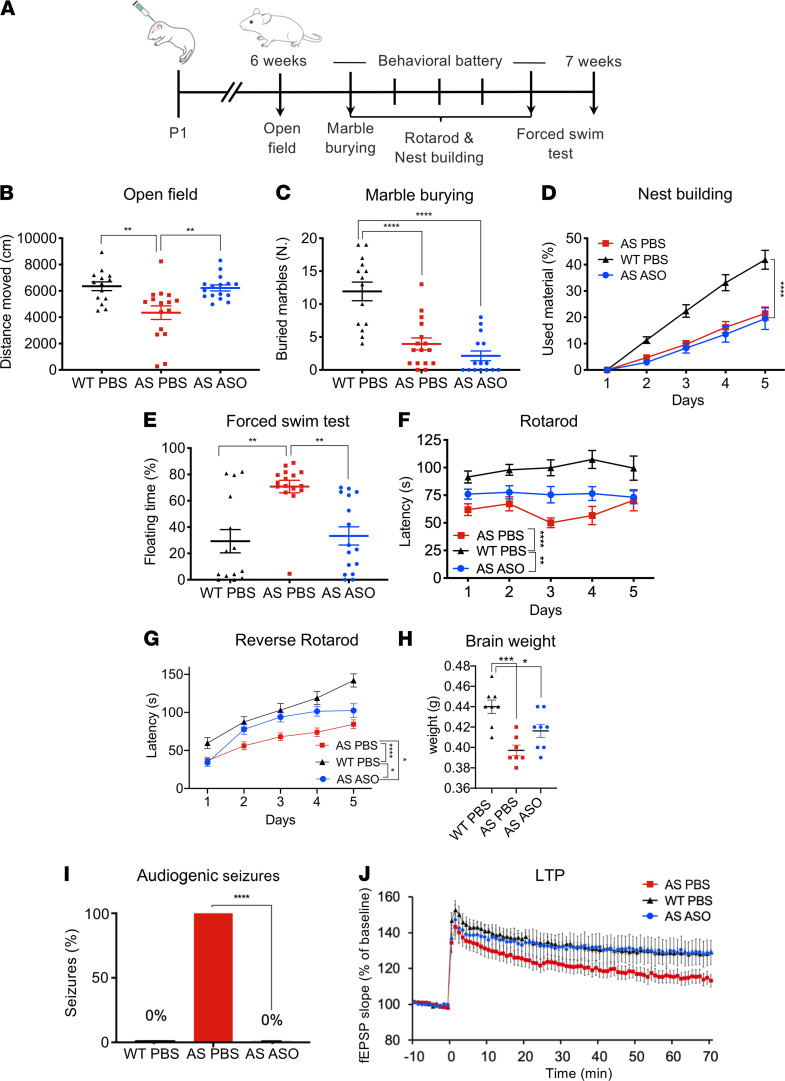
Angelman syndrome (AS) is a severe neurodevelopmental disorder for which only symptomatic treatment with limited benefits is available. AS is caused by mutations affecting the maternally inherited ubiquitin protein ligase E3A (UBE3A) gene. Previous studies showed that the silenced paternal Ube3a gene can be activated by targeting the antisense Ube3a-ATS transcript. We investigated antisense oligonucleotide-induced (ASO-induced) Ube3a-ATS degradation and its ability to induce UBE3A reinstatement and rescue of AS phenotypes in an established Ube3a mouse model. We found that a single intracerebroventricular injection of ASOs at postnatal day 1 (P1) or P21 in AS mice resulted in potent and specific UBE3A reinstatement in the brain, with levels up to 74% of WT levels in the cortex and a full rescue of sensitivity to audiogenic seizures. AS mice treated with ASO at P1 also showed rescue of established AS phenotypes, such as open field and forced swim test behaviors, and significant improvement on the reversed rotarod. Hippocampal plasticity of treated AS mice was comparable to WT but not significantly different from PBS-treated AS mice. No rescue was observed for the marble burying and nest building phenotypes. Our findings highlight the promise of ASO-mediated reactivation of UBE3A as a disease-modifying treatment for AS.

Keywords: Development; Mouse models; Neurodevelopment; Neurological disorders; Neuroscience.


Conflict of interest statement

Conflict of interest: This work was funded by F. Hoffmann-La Roche Ltd.

Figures

Figure 1
Figure 1. Paternal Ube3a silencing and ASO strategy to restore its expression in mouse neurons.
(A) Schematic representation of the mouse Ube3a genomic locus. Analogous to human, transcription of the paternal Ube3a-ATS from the same promoters encoding Snrpn, upstream of the PWS-IC (black filled circle), interferes with Ube3a transcription. For the knockdown of the Ube3a-ATS, a 3-10-3 gapmer antisense oligonucleotide (ASO) with phosphorothioate (PS) (black) and locked nucleic acid (LNA) modifications (green) for 3 nucleotides flanking the DNA core (black) was used (sequence indicated above). Upon RNaseH cleavage at the RNA/DNA hybrid site, the Ube3a-ATS was degraded; as a result Ube3a was unsilenced. (B) Concentration response curve of RTR26266 (M) in AS mouse neurons measuring both Ube3a-ATS and Ube3a mRNA expression.
Figure 2
Figure 2. P1 injection with ASO restores UBE3A expression in the brains of AS mice.
(A and B) Immunostaining at 4 weeks postinjection. (A) Brains (n = 2) of WT-PBS, AS-ASO, and AS-PBS injected mice were stained for UBE3A (green), showing widespread UBE3A reinstatement in ASO-treated AS mice. (B) Cortices (n = 2) of WT-PBS, AS-ASO, and AS-PBS injected mice stained for UBE3A (green) and parvalbumin (PV) (red) and counterstained for DAPI (blue), indicating that PV cells are positive for UBE3A. (C and D) Quantification of UBE3A expression in the cortex and hippocampus of ASO-treated AS mice and AS-PBS and WT littermates at different time points after P1 injection. Age is indicated in weeks on the x axis, and percentage of UBE3A in ASO-treated AS mice compared with WT mice is indicated on the y axis. One week after injection, UBE3A could be detected at 100 kDa. Actin, used as loading control, was detected at 45 kDa. The white vertical lines separating bands indicate noncontiguous lanes that were run on the same gel. Week 1: AS-ASO, n = 14; AS-PBS, n = 2; WT-PBS, n = 9. Week 2: AS-ASO, n = 3; WT-PBS, n = 3. Week 4: AS-ASO, n = 3; WT-PBS, n = 3. Week 6: AS-ASO, n = 2; WT-PBS, n = 3. Week 7: AS-ASO, n = 4; WT-PBS, n = 3. Week 9: cortex, AS-ASO, n = 7; WT-PBS, n = 4. Hippocampus, AS-ASO, n = 7; WT-PBS, n = 5. Scale bars: 200 μm (A), 100 μm (B). Data are represented as means ± SEM.
Figure 3
Figure 3. ICV injection of ASO at P1 rescues specific AS phenotypes.
(A) Schematic representation of ASO treatment and timeline for behavioral testing. (BF) Behavioral battery performed with WT-PBS (black, n = 14), AS-PBS (red, n = 16), and AS mice injected with ASO (blue, n = 16) in the open field, marble burying, nest building, forced swim tests, and accelerating rotarod. One-way or 2-way ANOVA was performed, with treatment plus genotype as independent variable for statistical analysis. (G) A new cohort of 6-week-old AS-PBS (n = 30), WT-PBS (n = 19), and AS-ASO (n = 17) mice was used for the reverse rotarod. A 2-way ANOVA was performed, with treatment plus genotype as independent variable for statistical analysis. (H) Brain weight of 7-week-old AS-PBS (n = 7), WT-PBS (n = 8), and AS-ASO (n = 8) mice. One-way ANOVA was performed, with treatment plus genotype as independent variable for statistical analysis. (I) Audiogenic seizures were rescued in P1-ASO–treated Ube3a–/+ mice: susceptibility to clonic-tonic seizures was visually observed in AS mice (n = 6) and not observed in ASO-treated mice (n = 10) or WT mice (n = 7). Fisher exact test was used as the statistical test. (J) LTP in AS mice treated with ASO showed a trend similar to WT mice. Both gave a higher response than AS mice, but this difference was not significant. Two-way ANOVA, followed by Bonferroni’s post hoc test, was used as the statistical test, with treatment and genotype as independent variables. Number of slices/mouse measured: AS-PBS (n = 13/6); AS-ASO (n = 16/8); WT-PBS (n = 13/6). Data represented as mean ± SEM. P values represent the significance level for the parameter and are displayed as stars in the figure: not shown if P > 0.05, *P ≤ 0.05, **P ≤ 0.01, ***P ≤ 0.001, ****P ≤ 0.0001. fEPSP, field excitatory postsynaptic potential.
Figure 4
Figure 4. P21 injection with ASO successfully restores UBE3A expression in AS mice and rescues epilepsy and hippocampal plasticity.
(A) Schematic representation of the timeline for ASO treatment, epilepsy testing, and LTP measurement. (B) Three weeks postinjection (n = 2) the brains of WT-PBS, AS-ASO, and AS-PBS mice were stained for UBE3A (green). The brains of AS mice treated with ASO show widely distributed nuclear UBE3A compared with the untreated AS brain. (CF) Western blots of lysates obtained 4 weeks after P21 injection of cortex, hippocampus, striatum, and cerebellum of AS mice treated with ASO (n = 3) and compared with age-matched WT controls and AS mice injected with PBS (n = 3). Two bands, representing the cytosolic and nuclear isoforms of UBE3A, can be detected at 100 kDa and ACTIN, here used as loading control, at 45 kDa. One-way ANOVA, followed by Tukey’s post hoc test, was used as statistical test. (G) Susceptibility to seizures visually observed in AS mice (n = 10) is rescued when treated with ASO at P21 (n = 13). Seizures are also absent in WT mice (n = 9). Fisher exact test was used as statistical test. (H) LTP measurement in AS mice treated with ASO (blue line), WT mice (black line), and AS mice (red line). Two-way ANOVA, followed by Bonferroni’s correction, was used as the statistical test. Number of slices used/mouse: AS-PBS (n = 26/5); AS-ASO (n = 27/7); WT-PBS (n = 23/4). Scale bars: 200 μm (B). Data are represented as means ± SEM. P values represent the significance level for the parameter and are displayed as stars in the figure: not shown if P > 0.05, *P ≤ 0.05, **P ≤ 0.01, ***P ≤ 0.001, ****P ≤ 0.0001.

References

    1. Mertz LGB, et al. Angelman syndrome in Denmark. Birth incidence, genetic findings, and age at diagnosis. Am J Med Genet A. 2013;161(9):2197–2203. doi: 10.1002/ajmg.a.36058. - DOI - PubMed
    1. Williams CA, et al. Angelman syndrome 2005: updated consensus for diagnostic criteria. Am J Med Genet. 2006;140 A(5):413–418. - PubMed
    1. LaSalle JM, et al. Epigenetic regulation of UBE3A and roles in human neurodevelopmental disorders. Epigenomics. 2015;7(7):1213–1228. doi: 10.2217/epi.15.70. - DOI - PMC - PubMed
    1. Buiting K, et al. Angelman syndrome-insights into a rare neurogenetic disorder. Nat Rev Neurol. 2016;12(10):584–593. doi: 10.1038/nrneurol.2016.133. - DOI - PubMed
    1. Rotaru DC, et al. Angelman syndrome: from mouse models to therapy. Neuroscience. 2020;445:172–189. doi: 10.1016/j.neuroscience.2020.02.017. - DOI - PubMed

Publication types

Substances