A secreted factor NimrodB4 promotes the elimination of apoptotic corpses by phagocytes in Drosophila
- PMID: 34370384
- PMCID: PMC8419693
- DOI: 10.15252/embr.202052262
A secreted factor NimrodB4 promotes the elimination of apoptotic corpses by phagocytes in Drosophila
Abstract
Programmed cell death plays a fundamental role in development and tissue homeostasis. Professional and non-professional phagocytes achieve the proper recognition, uptake, and degradation of apoptotic cells, a process called efferocytosis. Failure in efferocytosis leads to autoimmune and neurodegenerative diseases. In Drosophila, two transmembrane proteins of the Nimrod family, Draper and SIMU, mediate the recognition and internalization of apoptotic corpses. Beyond this early step, little is known about how apoptotic cell degradation is regulated. Here, we study the function of a secreted member of the Nimrod family, NimB4, and reveal its crucial role in the clearance of apoptotic cells. We show that NimB4 is expressed by macrophages and glial cells, the two main types of phagocytes in Drosophila. Similar to draper mutants, NimB4 mutants accumulate apoptotic corpses during embryogenesis and in the larval brain. Our study points to the role of NimB4 in phagosome maturation, more specifically in the fusion between the phagosome and lysosomes. We propose that similar to bridging molecules, NimB4 binds to apoptotic corpses to engage a phagosome maturation program dedicated to efferocytosis.
Keywords: Drosophila; Nimrod; apoptotic cell; bridging molecule; phagocytosis.
© 2021 The Authors. Published under the terms of the CC BY NC ND 4.0 license.
Conflict of interest statement
The authors declare that they have no conflict of interest.
Figures
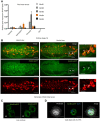
RT–qPCR analysis of NimB1, NimB2, NimB3, NimB4, and NimB5 transcripts, normalized to RpL32, from carcass, macrophages, fat body, and gut of wild‐type (w1118) L3 wandering larvae. Data are represented as mean ± SD from three independent experiments.
Representative confocal imaging of NimB4‐sGFP macrophages of embryo at stage 16; lateral (left) and ventral (right) views; tissues were stained with anti‐GFP (green, corresponding to NimB4‐sGFP) and anti‐SIMU antibodies (red, corresponding to macrophages). The arrows show the presence of NimB4‐sGFP inside the embryonic macrophages. Scale bars = 20 μm.
Representative live confocal imaging of NimB4‐sGFP macrophages of L3 wandering larvae at 30 and 60 min after dissection. Scale bars = 10 μm.
Representative confocal imaging of NimB4‐sGFP macrophages of L3 wandering larvae after fixation. Cells were stained with phalloidin (gray), DAPI (blue), and anti‐GFP (green, corresponding to NimB4‐sGFP). Scale bars = 10 μm.

- A
Representative confocal images from confocal stacks of NimB4‐sGFP third‐instar larval brains. Tissues were stained with anti‐GFP (green, corresponding to NimB4‐sGFP) and anti‐Draper (red, corresponding to glial cells). The arrows indicate the presence of NimB4‐sGFP in the glial cells of third‐instar larval brain. Scale bars = 100 μm.
- B, C
Quantification of the NimB4 transcripts, relative to RpL32 expression from macrophages (B) and fat body (C) extracts of wild‐type (w1118 ) animals in unchallenged conditions (UC) and 1, 2, 6 h after clean injury. Statistics compare a challenged sample and its own unchallenged sample. Data are represented as mean ± SD from three independent experiments with five animals each (*P < 0.05 by ANOVA test followed by post hoc Dunnett's multiple comparison tests. ns: not significant).
- D
Western blot analysis of hemolymph from L3 larvae expressing NimB4‐RFP, NimB5‐RFP, or SPvkg‐RFP from the fat body with the driver Lpp‐Gal4 driver. (NimB4: 77.4 kDa, NimB5: 62.3 kDa and RFP: 27 kDa, Tubulin: 55 kDa).
- E
Representative images of L3 larvae overexpressing NimB4‐RFP, SPvkg‐RFP (a secreted RFP), or CD8‐GFP in the fat body (CD8‐GFP is a membrane‐addressed GFP used to confirm that the Gal4 driver is not expressed in the nephrocytes) in the fat body. NimB4‐RFP and SPvkg‐RFP accumulate in the pericardial nephrocytes indicating that both proteins are secreted into the hemolymph. CD8‐GFP is absent from the pericardial nephrocyte indicating that the Lpp driver is not expressed in this tissue. The arrows show the presence of RFP in the pericardial nephrocytes of the larvae. The brightness of the image is modified to improve visualization of the signal.
- F
Representative images of L3 larvae overexpressing NimB4‐RFP, SPvkg‐RFP, or CD8‐GFP in the hemocyte. NimB4‐RFP and SPvkg‐RFP accumulate in the pericardial nephrocytes indicating that both proteins are secreted into the hemolymph. CD8‐GFP is absent from the pericardial nephrocyte indicating that the Hml driver is not expressed in nephrocytes. The arrows show the presence of RFP in the pericardial nephrocytes of the larvae. The brightness of the image is modified to improve visualization of the signal.

- A–C
Representative confocal imaging of CFSE‐stained apoptotic bodies (green) incubated with secreted NimB4‐RFP (B, C) or SPvkg‐RFP (A). Apoptotic bodies were pre‐incubated in absence (A, B) or presence (C) of Annexin V (25 μg/ml). Scale bar = 10 μm.
- D
Quantification of the colocalization of NimB4‐RFP or SPvkg‐RFP with the apoptotic bodies in presence or absence of Annexin V, as measured by Pearson's correlation coefficient. Values from at least four independent experiments are represented as mean ± SD (**P < 0.01 by ANOVA test followed by post hoc Dunnett's multiple comparison tests. ns: not significant).

Representative confocal imaging of apoptotic bodies (blue) and S2 cells (blue) incubated with secreted NimB4‐RFP. The brightness of the image is modified to improve visualization of the signal. Scale bar = 10 μm.
Representative confocal imaging of imaginal wing disks from NimB4‐sGFP third‐instar larvae expressing or not the pro‐apoptotic gene in the imaginal wing disk (Ap > UAS‐reaper NimB4‐sGFP). Imaginal wing disks were stained with DAPI (blue). The binding of NimB4‐sGFP is delimited inside the dashed line corresponding to apterous‐Gal4 expression. Scale bar = 10 μm.
Representative confocal imaging of apoptotic bodies (blue) derived from Lpp > NimB4‐RFP or Lpp > SPvkg‐RFP third‐instar larvae after clean injury. The brightness of the image is modified to improve visualization of the signal. Scale bar = 10 μm.
Quantification of the colocalization of NimB4‐RFP or SPvkg‐RFP with the apoptotic bodies, as measured by Pearson's correlation coefficient. Values from at least four independent experiments are represented as mean ± SD (*P < 0.05, by Mann–Whitney test).
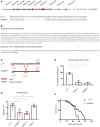
Representation of the Nimrod gene locus on the 2nd chromosome (cytology: 34E5). The NimB4sk2 mutation is a 14 bp deletion in the first exon. Scheme adapted from Ramond et al, (2020).
The mutation of NimB4 gene induces a frameshift leading to a premature stop codon.
Experimental design of qPCR assay to validate NimB4sk2 mutants. Scheme adapted from Ramond et al (2020).
Quantification of the distance (in cm) traveled in 1 min by wild‐type (w1118), NimB4sk2, draper▵5, and NimC11 larvae (n = 60 per genotype). The result shown is a mean of three independent experiments containing two cohorts each (*P < 0.05, **P < 0.01, ***P < 0.001 by ANOVA test followed by post hoc Dunnett's multiple comparison tests. ns: not significant).
Forty days old wild‐type (w1118), draper▵5 , and NimB4sk2 flies were tested using a standard climbing assay (mean ± SD), (n = 100 flies for each genotype), (*P < 0.05, ** P < 0.01, by ANOVA test followed by post hoc Dunnett's multiple comparison tests. ns: not significant).
Lifespan of NimB4sk2 (red) and wild‐type (w1118 , black) males kept on standard food at 25°C. The result shown is a mean of three independent experiments containing two cohorts of 20 male flies each (****P < 0.0001; log‐rank test).

Representative confocal imaging of wild‐type (w1118), NimB4sk2 , and apoptosis‐null NimB4sk2; Df(3L) H99 embryonic macrophages at stage 16 of development; ventral and lateral view; Tissues were co‐stained with Dcp‐1 (red, corresponding to apoptotic corpses) and anti‐SIMU (green, corresponding to macrophages) antibodies. The arrows show the presence of apoptotic cells inside embryonic macrophages. Scale bars = 20 μm.
Quantification of caspase‐positive particles (anti‐Dcp‐1, red) within macrophages (anti‐SIMU, green). Values from at least five independent experiments are represented as mean ± SD total volume of caspase‐positive particles (**P < 0.01, by Mann–Whitney test).
Representative projections from confocal stacks of entire third‐instar wild‐type (w1118) and NimB4sk2 larval brains stained with anti‐Draper (green) and anti‐Dcp‐1 (red). The arrows show the presence of apoptotic cells in the central area of NimB4sk2 larval brain. Scale bars = 100 μm.
Quantification of caspase‐positive particles in the central brain area of larval brain. Values from at least five independent experiments are represented as mean ± SD total volume of caspase‐positive particles (**P < 0.01, by Mann–Whitney test).
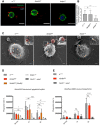
Representative confocal imaging of wild‐type (w1118), NimB4sk2 , and draper▵5 macrophages incubated with fluorescently labeled apoptotic cells (red, CellTrace™ Red) on ice for 1 h and stained with Alexa Fluor™ 488 phalloidin (green). Scale bar: 10 μm.
Quantification of the number of apoptotic cells (red) binding to the macrophages (green). Values from three independent experiments are represented as mean ± SD (***P < 0.001 by ANOVA test followed by post hoc Dunnett's multiple comparison tests. ns: not significant).
Representative Scanning Electron Microscopy images of spread macrophages extracted from wild‐type (w1118), NimB4sk2 , and draper▵5 L3 wandering larvae and incubated 30 min with apoptotic cells (artificially colored in red) at room temperature. The arrows show the binding of apoptotic cells to the macrophages. Scale bar: 1 μm.
Ex vivo phagocytosis assay using Alexa555 fluorescent apoptotic bodies. Wild‐type, NimB4sk2, NimB4 genomic rescue (NimB4sk2, [NimB4]), draper▵5 and NimC11, eater1 macrophages from L3 wandering were incubated with Alexa555 fluorescent apoptotic bodies for 30, 60, or 120 min at room temperature. Phagocytosis was quantified by flow cytometry. Data are represented as mean ± SD from three independent experiments (*P < 0.05, **P < 0.01, ****P < 0.0001 by ANOVA test followed by post hoc Dunnett's multiple comparison tests ns: not significant).
Ex vivo phagocytosis assay using AlexFluor488 Staphylococcus aureus Bioparticles. Wild‐type, NimB4sk2 , and NimC11, eater1 macrophages from L3 wandering were incubated with bioparticles for 30, 60, or 120 min at room temperature. Phagocytosis was quantified by flow cytometry. Data are represented as mean ± SD from three independent experiments (****P < 0.0001 by ANOVA test followed by post hoc Dunnett's multiple comparison tests. ns: not significant).
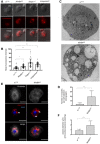
Representative fluorescence microscopy images of wild‐type (w1118), NimB4sk2 , draper▵5 , eater1 , and croquemort▵ third‐instar larvae macrophages stained with LysoTracker Red (live imaging). Overlay of fluorescence and differential interference contrast microscopy (DIC). Scale bar = 10 μm.
Mean fluorescence intensity after staining with LysoTracker Red (live confocal imaging). Values from at least three independent experiments are represented as mean ± SD (**P < 0.01, ****P < 0.0001 by ANOVA test followed by post hoc Dunnett's multiple comparison tests).
Representative transmission electron micrographs of macrophages from wild‐type (top, w1118) and NimB4sk2 (bottom) L3 wandering larvae. Scale bar: 2 μm.
Quantification of the number of vesicles per macrophages in the electron micrographs. Values from at least three independent experiments are represented as mean ± SD (****P < 0.0001 by Mann–Whitney test).
Representative confocal imaging of Rab7EYFP immunostaining in wild‐type (w1118) and NimB4sk2 macrophages. Tissues were stained with anti‐GFP (red, Rab7), counterstained with phalloidin (gray) and DAPI (blue). The arrows indicate the enlarged vesicles are decorated with Rab7EYFP in the NimB4sk2 macrophages. Scale bar = 10 μm.
Quantification of the diameter of the vesicles. Values from at least three independent experiments are represented as mean ± SD (****P < 0.0001 by Mann–Whitney test).
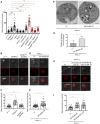
Mean fluorescence intensity after staining with LysoTracker Red (confocal live imaging). Values from at least three independent experiments are represented as mean ± SD (*P < 0.05, ***P < 0.001 ****P < 0.0001 by ANOVA test followed by post hoc Dunnett's multiple comparison tests. ns: not significant).
Representative fluorescence microscopy images of wild‐type (w1118 ), NimB4sk2, and NimB4 genomic rescue (NimB4sk2, [NimB4]) macrophages stained with LysoTracker Red probe (live imaging). Lower panels show an overlay of fluorescence and DIC. Scale bar = 10 μm.
Mean fluorescence intensity after staining with LysoTracker Red (confocal live imaging). Values from at least three independent experiments are represented as mean ± SD (****P < 0.0001 by ANOVA test followed by post hoc Dunnett's multiple comparison tests. ns: not significant).
Representative fluorescence microscopy images of wild‐type macrophages (HmlΔ>+) and macrophages expressing NimB4‐RNAi (HmlΔ > NimB4‐IR) stained with LysoTracker Red probe (live imaging). Lower panels show an overlay of fluorescence and DIC. Scale bar = 10 μm.
Mean fluorescence intensity after staining with LysoTracker Red (confocal live imaging). Values from at least three independent experiments are represented as mean ± SD (****P < 0.0001 by Mann–Whitney test).
Representative transmission electron micrographs of macrophages from control macrophages (HmlΔ>+) and macrophages expressing NimB4‐RNAi (HmlΔ > NimB4‐IR) from L3 wandering larvae. Scale bar: 2 μm.
Quantification of the number of vacuoles per macrophages. Values from at least three independent experiments are represented as mean ± SD (**P < 0.01, by Mann–Whitney test).
Representative fluorescence microscopy images of macrophages from wild‐type (HmlΔts >+) or macrophages expressing NimB4‐IR (HmlΔts > NimB4‐IR) using a temperature‐inducible macrophage driver HmlΔts to restrict the expression of NimB4‐IR after the second‐instar larval (L2) stage. HmlΔts > KK NimB4‐IR (29°C) larvae developed at 29°C whereas HmlΔts > KK NimB4‐IR (18–29°C) larvae were shifted from 18 to 29°C at the second‐instar larval stage. Macrophages were stained with LysoTracker Red probe. Lower panels show an overlay of fluorescence and DIC. Scale bar = 10 μm.
Mean fluorescence intensity after staining with LysoTracker Red (confocal live imaging). Values from at least three independent experiments are represented as mean ± SD (****P < 0.0001 by ANOVA test followed by post hoc Dunnett's multiple comparison tests. ns: not significant).
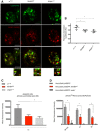
Representative confocal imaging of localization of Lamp1‐mcherry and LysoTracker Green in wild‐type (w1118), NimB4 sk2, and draper▵5 macrophages (live imaging). The arrows indicate the colocalization (w1118 ) or the clustering (NimB4sk2 and draper▵5 ) of Lamp1‐mcherry and LysoTracker Green signals. Scale bar: 10 μm.
Quantification of the colocalization of Lamp1‐mcherry with LysoTracker Green, as measured by Pearson's correlation coefficient between the two signals. Values from at least five independent experiments are represented as mean ± SD (*P < 0.05 by ANOVA test followed by post hoc Dunnett's multiple comparison tests).
Ex vivo phagocytosis assay using apoptotic cells labeled with pHrodo™ Red. Wild‐type (w1118 ), NimB4sk2, and draper▵5 macrophages from L3 wandering larvae were incubated with pHrodo™ Red apoptotic cells for 60 min at room temperature. Phagocytosis was quantified by flow cytometry. Data are represented as mean ± SD from three independent experiments (*P < 0.05 by ANOVA test followed by post hoc Dunnett's multiple comparison tests. ns: not significant).
Ex vivo phagocytosis assay using pHrodo™ Red Staphylococcus aureus Bioparticles™ conjugates. Wild‐type, NimB4sk2 and NimC11, eater1 HmlΔ‐Gal4 > UAS‐GFP macrophages from L3 wandering larvae were incubated with pHrodo™ Red S. aureus Bioparticles™ for 30, 60, or 120 min at room temperature. Phagocytosis was quantified by flow cytometry. Data are represented as mean ± SD from three independent experiments (*P < 0.05 by ANOVA test followed by post hoc Dunnett's multiple comparison tests. ns: not significant).

Confocal imaging of wild‐type and NimB4 sk2 larval macrophages expressing the reporter Lamp1‐mcherry. Tissues were stained with an anti‐mCherry antibody (red, corresponding to the Lamp1 signal) and DAPI (blue). Wild‐type macrophages (w1118 ) were incubated in the presence or in the absence of Chloroquine (50 μg/ml) for 40 min. Scale bar = 10 μm.
Mean fluorescence intensity after staining with LysoTracker Red. Values from at least three independent experiments are represented as mean ± SD (***P < 0.001 by ANOVA test followed by post hoc Dunnett's multiple comparison tests. ns: not significant).

- A–B
Representative fluorescence microscopy images of wild‐type (A) or NimB4sk2 (B) macrophages expressing Rab5 (middle panel) or Rab7 (right panel) driven by HmlΔ‐Gal4 and stained with the LysoTracker Red (live imaging). Overlay of fluorescence and DIC. Scale bar = 10 μm.
- C
Quantification of the mean fluorescence intensity of LysoTracker in macrophages from larvae (confocal live imaging). Values from at least three independent experiments are represented as mean ± SD (**P < 0.01, ****P < 0.0001 by ANOVA test followed by post hoc Dunnett's multiple comparison tests. ns: not significant).
Similar articles
-
The secreted Nimrod protein NimB1 negatively regulates early steps of apoptotic cell phagocytosis in Drosophila.Development. 2025 Aug 15;152(16):dev204919. doi: 10.1242/dev.204919. Epub 2025 Aug 15. Development. 2025. PMID: 40679075
-
Apoptotic Cell Clearance in Drosophila melanogaster.Front Immunol. 2017 Dec 20;8:1881. doi: 10.3389/fimmu.2017.01881. eCollection 2017. Front Immunol. 2017. PMID: 29326726 Free PMC article. Review.
-
Clearance of apoptotic corpses.Apoptosis. 2009 Aug;14(8):1029-37. doi: 10.1007/s10495-009-0335-9. Apoptosis. 2009. PMID: 19291407 Review.
-
Draper-mediated JNK signaling is required for glial phagocytosis of apoptotic neurons during Drosophila metamorphosis.Glia. 2018 Jul;66(7):1520-1532. doi: 10.1002/glia.23322. Epub 2018 Mar 9. Glia. 2018. PMID: 29520845
-
Santa-maria is a glial phagocytic receptor that acts with SIMU to recognize and engulf apoptotic neurons.Cell Rep. 2025 Jan 28;44(1):115201. doi: 10.1016/j.celrep.2024.115201. Epub 2025 Jan 10. Cell Rep. 2025. PMID: 39799566
Cited by
-
Understanding the diversity and dynamics of in vivo efferocytosis: Insights from the fly embryo.Immunol Rev. 2023 Oct;319(1):27-44. doi: 10.1111/imr.13266. Epub 2023 Aug 17. Immunol Rev. 2023. PMID: 37589239 Free PMC article. Review.
-
The role of secreted proteins in efferocytosis.Front Cell Dev Biol. 2024 Jan 8;11:1332482. doi: 10.3389/fcell.2023.1332482. eCollection 2023. Front Cell Dev Biol. 2024. PMID: 38259511 Free PMC article. Review.
-
Phagocytosis Is the Sole Arm of Drosophila melanogaster Known Host Defenses That Provides Some Protection Against Microsporidia Infection.Front Immunol. 2022 Apr 13;13:858360. doi: 10.3389/fimmu.2022.858360. eCollection 2022. Front Immunol. 2022. PMID: 35493511 Free PMC article.
-
Innate immune and proinflammatory signals activate the Hippo pathway via a Tak1-STRIPAK-Tao axis.Nat Commun. 2024 Jan 2;15(1):145. doi: 10.1038/s41467-023-44542-y. Nat Commun. 2024. PMID: 38168080 Free PMC article.
-
The phagocytic cyst cells in Drosophila testis eliminate germ cell progenitors via phagoptosis.Sci Adv. 2022 Jun 17;8(24):eabm4937. doi: 10.1126/sciadv.abm4937. Epub 2022 Jun 17. Sci Adv. 2022. PMID: 35714186 Free PMC article.
References
-
- Akakura S, Singh S, Spataro M, Akakura R, Kim J‐I, Albert ML, Birge RB (2004) The opsonin MFG‐E8 is a ligand for the αvβ5 integrin and triggers DOCK180‐dependent Rac1 activation for the phagocytosis of apoptotic cells. Exp Cell Res 292: 403–416 - PubMed
-
- Alvarez‐Dominguez C, Barbieri AM, Berón W, Wandinger‐Ness A, Stahl PD (1996) Phagocytosed live listeria monocytogenes influences Rab5‐regulated in vitro phagosome‐endosome fusion. J Biol Chem 271: 13834–13843 - PubMed
Publication types
MeSH terms
Grants and funding
LinkOut - more resources
Full Text Sources
Molecular Biology Databases

