. 2021 Oct;174(10):1409-1419.
doi: 10.7326/M21-1991. Epub 2021 Aug 10.

Clinical Trends Among U.S. Adults Hospitalized With COVID-19, March to December 2020 : A Cross-Sectional Study

Affiliations

Clinical Trends Among U.S. Adults Hospitalized With COVID-19, March to December 2020 : A Cross-Sectional Study

Shikha Garg et al. Ann Intern Med. 2021 Oct.

Abstract

Background: The COVID-19 pandemic has caused substantial morbidity and mortality.

Objective: To describe monthly clinical trends among adults hospitalized with COVID-19.

Design: Pooled cross-sectional study.

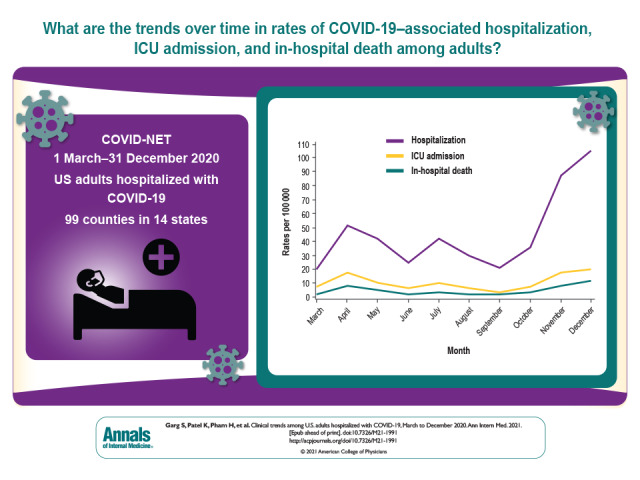
Setting: 99 counties in 14 states participating in the Coronavirus Disease 2019-Associated Hospitalization Surveillance Network (COVID-NET).

Patients: U.S. adults (aged ≥18 years) hospitalized with laboratory-confirmed COVID-19 during 1 March to 31 December 2020.

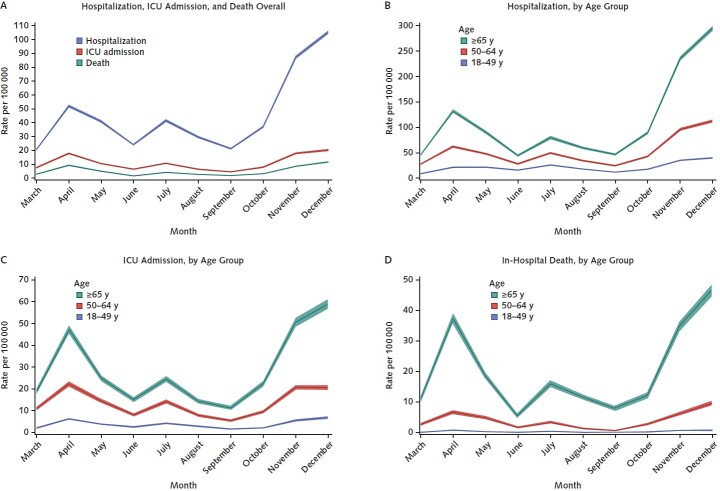
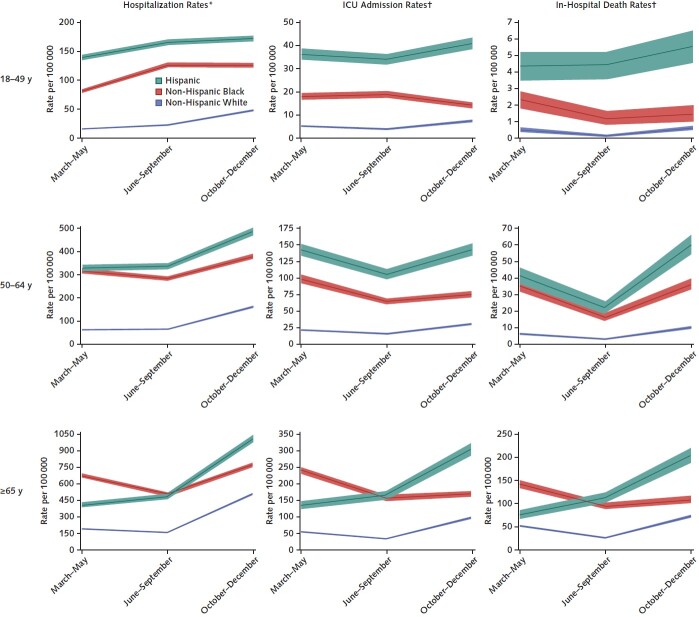
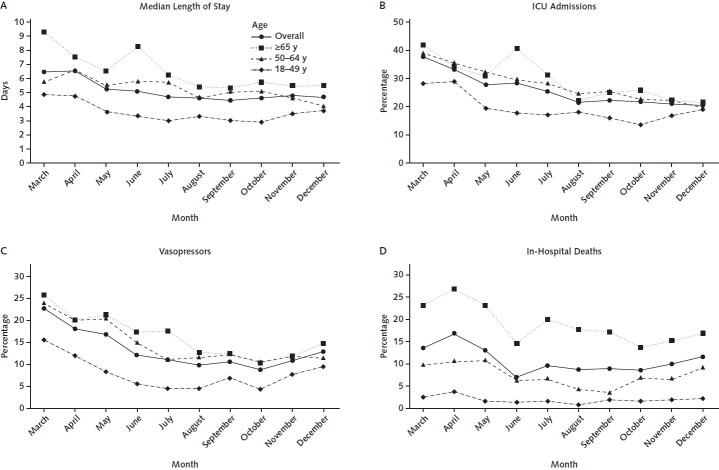
Measurements: Monthly hospitalizations, intensive care unit (ICU) admissions, and in-hospital death rates per 100 000 persons in the population; monthly trends in weighted percentages of interventions, including ICU admission, mechanical ventilation, and vasopressor use, among an age- and site-stratified random sample of hospitalized case patients.

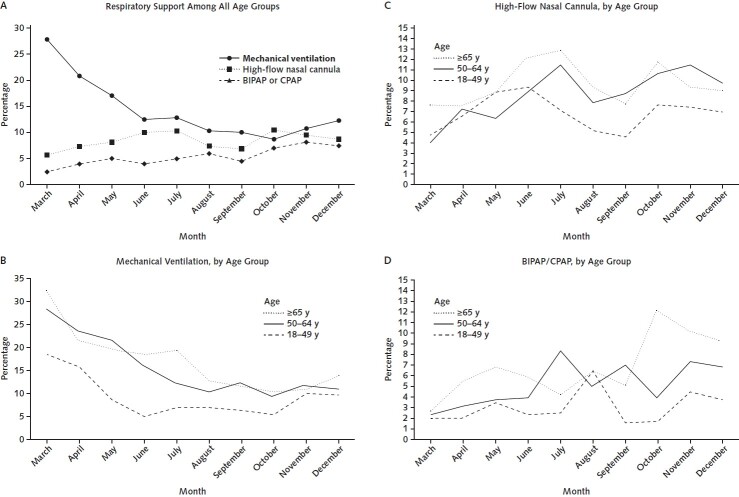
Results: Among 116 743 hospitalized adults with COVID-19, the median age was 62 years, 50.7% were male, and 40.8% were non-Hispanic White. Monthly rates of hospitalization (105.3 per 100 000 persons), ICU admission (20.2 per 100 000 persons), and death (11.7 per 100 000 persons) peaked during December 2020. Rates of all 3 outcomes were highest among adults aged 65 years or older, males, and Hispanic or non-Hispanic Black persons. Among 18 508 sampled hospitalized adults, use of remdesivir and systemic corticosteroids increased from 1.7% and 18.9%, respectively, in March to 53.8% and 74.2%, respectively, in December. Frequency of ICU admission, mechanical ventilation, and vasopressor use decreased from March (37.8%, 27.8%, and 22.7%, respectively) to December (20.5%, 12.3%, and 12.8%, respectively); use of noninvasive respiratory support increased from March to December.

Limitation: COVID-NET covers approximately 10% of the U.S. population; findings may not be generalizable to the entire country.

Conclusion: Rates of COVID-19-associated hospitalization, ICU admission, and death were highest in December 2020, corresponding with the third peak of the U.S. pandemic. The frequency of intensive interventions for management of hospitalized patients decreased over time. These data provide a longitudinal assessment of clinical trends among adults hospitalized with COVID-19 before widespread implementation of COVID-19 vaccines.

Primary funding source: Centers for Disease Control and Prevention.


Conflict of interest statement

Disclosures: Disclosures can be viewed at www.acponline.org/authors/icmje/ConflictOfInterestForms.do?msNum=M21-1991.

Figures

Visual Abstract.
Visual Abstract.. Clinical Trends in COVID-19 Hospitalizations.
This study used data from a national CDC network to examine trends related to COVID-19 hospitalization, care, and clinical outcomes across the United States.
Figure 1.
Figure 1.. Rates (with 95% CIs) of COVID-19–associated hospitalization, ICU admission, and in-hospital death, by age group and month.
For hospitalization rate calculations, all identified cases in the Coronavirus Disease 2019–Associated Hospitalization Surveillance Network were used (n = 116 743). Unadjusted hospitalization rates per 100 000 persons in the population were calculated by taking the total number of hospitalized case patients each month, divided by 2019 bridged-race postcensal estimates of the population from the National Center for Health Statistics (NCHS), for the counties included in surveillance. For calculation of ICU admission and in-hospital death rates, a sample of hospitalized case patients with completed medical record review and a discharge disposition was used (n = 18 508). Unadjusted ICU admission and in-hospital death rates per 100 000 persons in the population among hospitalized patients were calculated using the weighted number of sampled case patients per month with each outcome as the numerator, divided by 2019 bridged-race postcensal estimates of the population from the National Center for Health Statistics (NCHS), for the counties included in surveillance. ICU = intensive care unit.
Appendix Figure.
Appendix Figure.. Rates (with 95% CIs) of COVID-19–associated hospitalization, ICU admission, and in-hospital death, by age and race/ethnicity.
Y-axis scales vary across panels. “Hispanic” indicates Hispanic or Latino. ICU = intensive care unit. * All hospitalized Coronavirus Disease 2019–Associated Hospitalization Surveillance Network (COVID-NET) case patients with known race/ethnicity who were classified as non-Hispanic White, non-Hispanic Black, or Hispanic were included in this analysis (n = 101 021). Unadjusted hospitalization rates per 100 000 persons in the population were calculated by taking the total number of hospitalized case patients each month, divided by 2019 bridged-race postcensal estimates of the population from the National Center for Health Statistics (NCHS), for the counties included in surveillance. † A sample of hospitalized COVID-NET case patients with completed medical record review, a discharge disposition, and known race/ethnicity who were classified as non-Hispanic White, non-Hispanic Black, or Hispanic was used in this analysis (n = 16 035). Unadjusted rates of ICU admission and in-hospital death per 100 000 persons in the population among hospitalized patients were calculated using the weighted number of sampled cases per month with each outcome as the numerator, divided by 2019 bridged-race postcensal estimates of the population from the National Center for Health Statistics (NCHS), for the counties included in surveillance.
Figure 2.
Figure 2.. Trends in median length of stay and percentages of interventions and outcomes among a sample of hospitalized adults with COVID-19, by age group and month.
All percentages are weighted. ICU = intensive care unit.
Figure 3.
Figure 3.. Trends in highest level of respiratory support received among a sample of hospitalized adults with COVID-19, by age group and month.
All percentages are weighted. BIPAP = bilevel positive airway pressure; CPAP = continuous positive airway pressure; ICU = intensive care unit.

References

    1. Reese H , Iuliano AD , Patel NN , et al. Estimated incidence of coronavirus disease 2019 (COVID-19) illness and hospitalization—United States, February–September 2020. Clin Infect Dis. 2021;72:e1010-e1017. [PMID: ] doi:10.1093/cid/ciaa1780 - DOI - PMC - PubMed
    1. Centers for Disease Control and Prevention. Estimated disease burden of COVID-19. 2020. Accessed at www.cdc.gov/coronavirus/2019-ncov/cases-updates/burden.html on 20 April 2021.
    1. Bhatraju PK , Ghassemieh BJ , Nichols M , et al. Covid-19 in critically ill patients in the Seattle region — case series. N Engl J Med. 2020;382:2012-2022. [PMID: ] doi:10.1056/NEJMoa2004500 - DOI - PMC - PubMed
    1. Cummings MJ , Baldwin MR , Abrams D , et al. Epidemiology, clinical course, and outcomes of critically ill adults with COVID-19 in New York City: a prospective cohort study. Lancet. 2020;395:1763-1770. [PMID: ] doi:10.1016/S0140-6736(20)31189-2 - DOI - PMC - PubMed
    1. Garg S , Kim L , Whitaker M , et al. Hospitalization rates and characteristics of patients hospitalized with laboratory-confirmed coronavirus disease 2019 — COVID-NET, 14 states, March 1–30, 2020. MMWR Morb Mortal Wkly Rep. 2020;69:458-464. [PMID: ] doi:10.15585/mmwr.mm6915e3 - DOI - PMC - PubMed

MeSH terms