. 2021 Sep 1;321(3):E433-E442.
doi: 10.1152/ajpendo.00380.2020. Epub 2021 Aug 9.

Obesity protects against sepsis-induced and norepinephrine-induced white adipose tissue browning

Affiliations

Obesity protects against sepsis-induced and norepinephrine-induced white adipose tissue browning

Cheryl Li et al. Am J Physiol Endocrinol Metab. .

Abstract

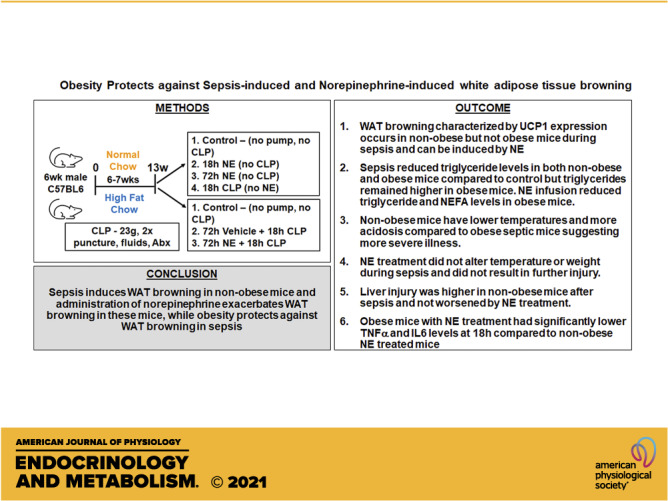
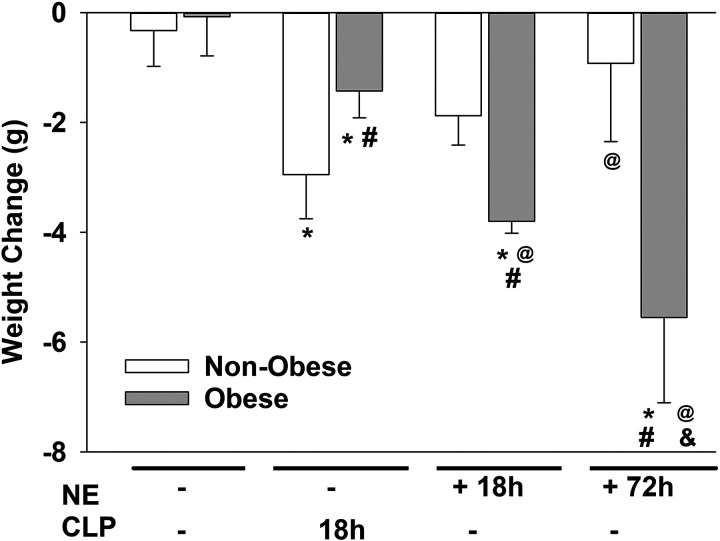
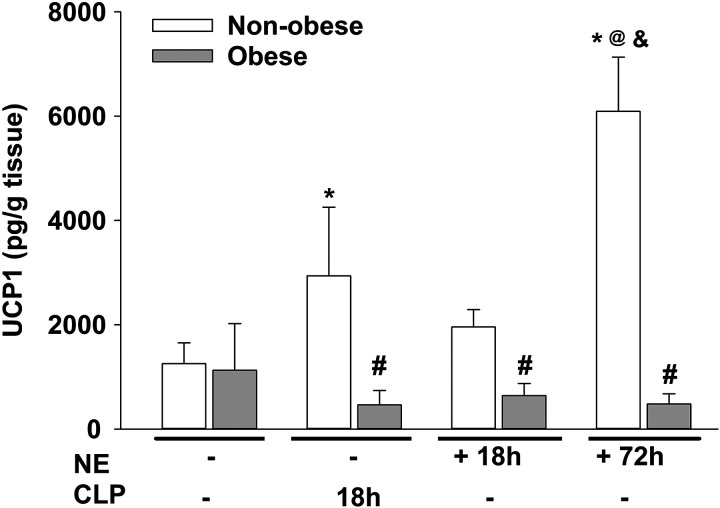
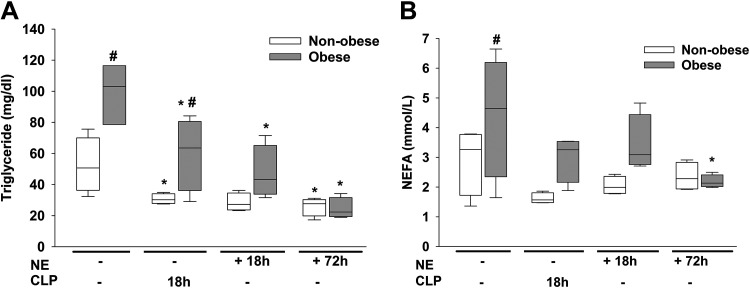
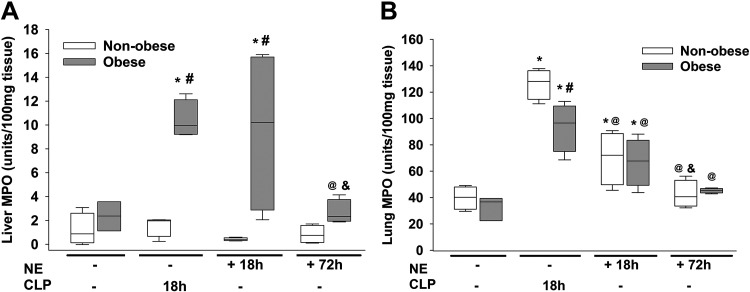
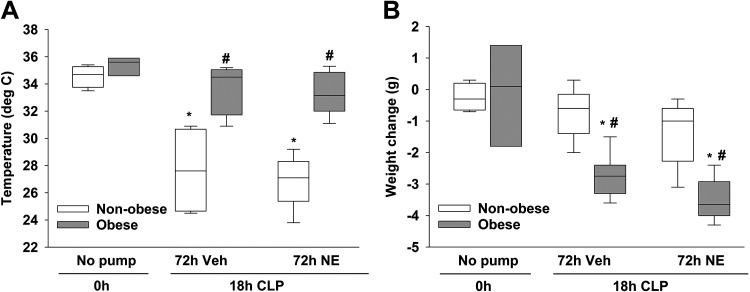
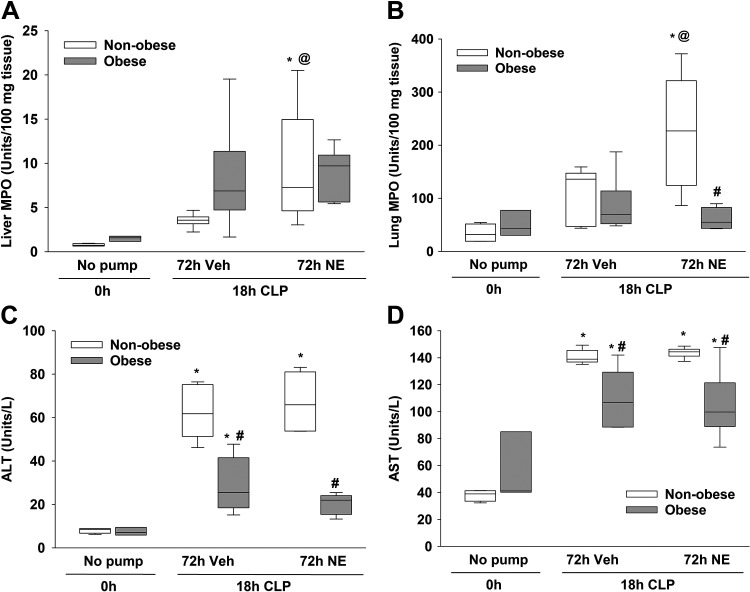
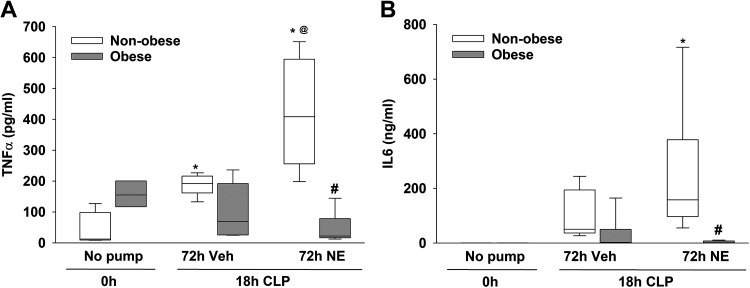
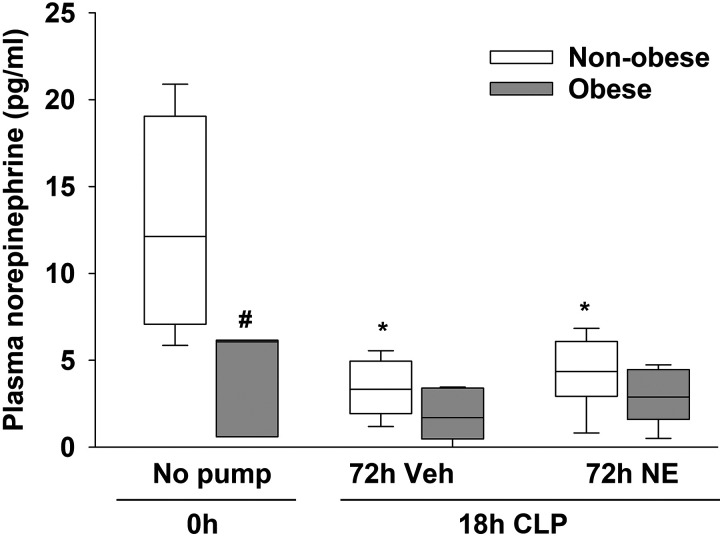
Sepsis is a dysregulated systemic response to infection and can lead to organ damage and death. Obesity is a significant problem worldwide and affects outcomes from sepsis. Our laboratory demonstrated that white adipose tissue (WAT) undergoes browning during sepsis, a process whereby WAT adopts a brown adipose tissue phenotype. However, this browning process was not observed in obese mice during sepsis. White adipose tissue browning is detrimental in patients with burn injury and cancer. We hypothesize that norepinephrine (NE) induces WAT browning in nonobese mice but not in obese mice similarly to sepsis-induced WAT browning. Six-week-old C57BL/6 male mice were randomized to a high-fat diet or normal diet. After 6-7 wk of feeding, polymicrobial sepsis was induced by cecal ligation and puncture (CLP). Norepinephrine was administered intraperitoneally via osmotic minipumps for 18 h or 72 h (no CLP) at which time tissue and plasma were harvested. Controls were mice that underwent CLP (no NE) with 18-h harvest. A separate group of mice underwent pretreatment with NE or vehicle infusion for 72 h, CLP was performed, and at 18 h had tissue and plasma harvested. Sepsis resulted in significant weight loss in both nonobese and obese mice. NE treatment alone caused weight loss in obese mice. Septic nonobese mice had higher uncoupling protein-1 (UCP1) expression compared with control and obese septic mice. NE treatment increased UCP1 expression in nonobese, but not obese mice. NE-treated obese septic mice had lower lung myeloperoxidase (MPO) activity, alanine aminotransferase (ALT), aspartate aminotransferase (AST), TNFα, and IL-6 levels compared with NE-treated nonobese septic mice. Obesity protects mice from septic-induced and NE-induced WAT browning.NEW & NOTEWORTHY White adipose tissue browning is detrimental in patients with burn injury and cancer. WAT browning occurs in nonobese mice and can be induced by β receptor norepinephrine infusion, but obese mice are resistant to sepsis-induced and norepinephrine-induced WAT browning. We propose that the lack of WAT browning and unchanged inflammatory cytokine response may contribute to the protection of obese mice from sepsis.

Keywords: adipose tissue; browning; obesity; sepsis.


Conflict of interest statement

J.K. reports financial support to the institution for work on DSMB of a clinical trial (Eli Lilly) and participation on a sepsis advisory board (Roche) which are not related in any way to the work in the manuscript.

Figures

None
Graphical abstract
Figure 1.
Figure 1.
Effects of pharmacological and sepsis-induced WAT browning on weight. Weight change was measured as the difference between weight after dietary intervention and weight at tissue harvest. Data represent means ± SD and were analyzed by two-way ANOVA with Holm–Sidak method with all pairwise multiple comparisons. *P ≤ 0.05 vs. control (no NE, no CLP) within diet, #P ≤ 0.05 vs. nonobese within time, @P ≤ 0.05 vs. CLP 18 h within diet, &P ≤ 0.05 vs. NE 18 h within diet. White boxes = nonobese, gray boxes = obese mice (n = 4 mice/group). CLP, cecal ligation and puncture; NE, norepinephrine; WAT, white adipose tissue.
Figure 2.
Figure 2.
Norepinephrine infusion increased UCP1 protein expression. Mitochondrial UCP1 expression in eWAT in nonobese and obese mice with norepinephrine treatment for 18 or 72 h. Separate groups of mice underwent tissue harvest at 18 h after CLP. Control mice did not receive NE and did not undergo CLP. Data represent means ± SD and were analyzed by two-way ANOVA with Holm-Sidak method with all pairwise multiple comparisons. *P ≤ 0.05 vs. control (no NE, no CLP) within diet, #P ≤ 0.05 vs. nonobese within time, @P ≤ 0.05 vs. CLP 18 h within diet, &P ≤ 0.05 vs. NE 18 h within diet. White boxes = nonobese, gray boxes = obese mice (n = 3 or 4 mice/group). CLP, cecal ligation and puncture; eWAT, epididymal white adipose tissue; NE, norepinephrine; UCP1, uncoupling protein-1.
Figure 3.
Figure 3.
Norepinephrine infusion alters plasma triglyceride and NEFA levels. Plasma triglyceride (A) and NEFA (B) levels in nonobese and obese mice with norepinephrine treatment for 18 or 72 h. Separate groups of mice underwent tissue harvest at 18 h after CLP. Control mice did not receive NE and did not undergo CLP. Vertical box represents 25th percentile (bottom line), median (middle line), and 75th percentile (top line) values, whiskers represent 10th and 90th percentiles. Data were analyzed by two-way ANOVA with Holm–Sidak method with multiple comparisons vs. control group (nonobese, no CLP). *P ≤ 0.05 vs. control (no NE, no CLP) within diet, #P ≤ 0.05 vs. nonobese within time. White boxes = nonobese, gray boxes = obese mice (n = 3 or 4 mice/group). CLP, cecal ligation and puncture; NE, norepinephrine.
Figure 4.
Figure 4.
Effects of WAT browning on liver (A) and lung (B) neutrophil infiltration. Lung and liver MPO activity was determined in nonobese and obese mice with sepsis or norepinephrine treatment. Vertical box represents 25th percentile (bottom line), median (middle line), and 75th percentile (top line) values, whiskers represent 10th and 90th percentiles. Data were analyzed by two-way ANOVA with Holm–Sidak method with all pairwise multiple comparisons. *P ≤ 0.05 vs. control (no NE, no CLP) within diet, #P ≤ 0.05 vs. nonobese within time, @P ≤ 0.05 vs. CLP 18 h by diet, &P ≤ 0.05 vs. NE 18 h within diet. White boxes = nonobese, gray boxes = obese mice (n = 3 or 4 mice/group). CLP, cecal ligation and puncture; NE, norepinephrine; MPO, myeloperoxidase; WAT, white adipose tissue.
Figure 5.
Figure 5.
Effects of WAT browning on temperature (A) and weight change (B). Temperature was measured in nonobese and obese mice. Weight change was measured as the difference between weight after dietary intervention and weight at tissue harvest. Vertical box represents 25th percentile (bottom line), median (middle line), and 75th percentile (top line) values, whiskers represent 10th and 90th percentiles. Data were analyzed by two-way ANOVA with Holm-Sidak method. *P ≤ 0.05 vs. no CLP within diet, #P ≤ 0.05 vs. nonobese within treatment. White boxes = nonobese, gray boxes = obese mice (n = 3–6 mice/group). CLP, cecal ligation and puncture; WAT, white adipose tissue.
Figure 6.
Figure 6.
Effects of WAT browning on organ injury. Liver MPO (A), lung MPO (B), ALT (C), AST (D). Lung and liver MPO activity was determined in nonobese and obese mice with sepsis or norepinephrine treatment. ALT and AST were measured in plasma. Vertical box represents 25th percentile (bottom line), median (middle line), and 75th percentile (top line) values, whiskers represent 10th and 90th percentiles. Data were analyzed by two-way ANOVA with Holm–Sidak method. *P ≤ 0.05 vs. no CLP within diet, #P ≤ 0.05 vs. nonobese within treatment, @P ≤ 0.05 vs. vehicle within diet. White boxes = nonobese, gray boxes = obese mice (n = 3–6 mice/group). ALT, alanine aminotransferase; AST, aspartate aminotransferase; CLP, cecal ligation and puncture; MPO, myeloperoxidase.
Figure 7.
Figure 7.
Effects of WAT browning on plasma cytokine levels. Plasma TNFα (A) and IL-6 (B) levels in nonobese and obese mice with vehicle or norepinephrine treatment after CLP. Vertical box represents 25th percentile (bottom line), median (middle line), and 75th percentile (top line) values, whiskers represent 10th and 90th percentiles. Data were analyzed by two-way ANOVA with Holm–Sidak method. *P ≤ 0.05 vs. no CLP within diet, #P ≤ 0.05 vs. nonobese within treatment, @P ≤ 0.05 vs. vehicle within diet. White boxes = nonobese, gray boxes = obese mice (n = 3–6 mice/group). CLP, cecal ligation and puncture; WAT, white adipose tissue.
Figure 8.
Figure 8.
Effects of WAT browning on plasma norepinephrine levels. Plasma norepinephrine levels in nonobese and obese mice with vehicle or norepinephrine treatment after CLP. Vertical box represents 25th percentile (bottom line), median (middle line), and 75th percentile (top line) values, whiskers represent 10th and 90th percentiles. Data were analyzed by two-way ANOVA with Holm–Sidak method. *P ≤ 0.05 vs. no CLP within diet, #P ≤ 0.05 vs. nonobese within treatment. White boxes = nonobese, gray boxes = obese mice (n = 3–6 mice/group). CLP, cecal ligation and puncture; WAT, white adipose tissue.

Similar articles

Cited by

References

    1. Kolyva AS, Zolota V, Mpatsoulis D, Skroubis G, Solomou EE, Habeos IG, Assimakopoulos SF, Goutzourelas N, Kouretas D, Gogos CA. The role of obesity in the immune response during sepsis. Nutr Diabetes 4: e137–e137, 2014. doi:10.1038/nutd.2014.34. - DOI - PMC - PubMed
    1. Epstein L, Dantes R, Magill S, Fiore A. Varying estimates of sepsis mortality using death certificates and administrative codes–United States, 1999-2014. MMWR Morb Mortal Wkly Rep 65: 342–345, 2016. doi:10.15585/mmwr.mm6513a2. - DOI - PubMed
    1. Masters RK, Reither EN, Powers DA, Yang YC, Burger AE, Link BG. The impact of obesity on US mortality levels: the importance of age and cohort factors in population estimates. Am J Public Health 103: 1895–1901, 2013. doi:10.2105/AJPH.2013.301379. - DOI - PMC - PubMed
    1. Huttunen R, Laine J, Lumio J, Vuento R, Syrjänen J. Obesity and smoking are factors associated with poor prognosis in patients with bacteraemia. BMC Infect Dis 7: 13, 2007. doi:10.1186/1471-2334-7-13. - DOI - PMC - PubMed
    1. Thavamani A, Umapathi KK, Sankararaman S, Roy A. Effect of obesity on mortality among hospitalized paediatric patients with severe sepsis. Pediatr Obes 16: e12777, 2021. doi:10.1111/ijpo.12777. - DOI - PubMed

Publication types