Dynamic physiological responses in obese and non-obese adults submitted to cardiopulmonary exercise test
- PMID: 34370766
- PMCID: PMC8351979
- DOI: 10.1371/journal.pone.0255724
Dynamic physiological responses in obese and non-obese adults submitted to cardiopulmonary exercise test
Abstract
Purpose: Obese individuals have reduced performance in cardiopulmonary exercise testing (CPET), mainly considering peak values of variables such as oxygen uptake ([Formula: see text]), carbon dioxide production ([Formula: see text]), tidal volume (Vt), minute ventilation ([Formula: see text]) and heart rate (HR). The CPET interpretation and prognostic value can be improved through submaximal ratios analysis of key variables like [Formula: see text], [Formula: see text], [Formula: see text] [Formula: see text] and oxygen uptake efficiency slope (OUES). The obesity influence on these responses has not yet been investigated. Our purpose was to evaluate the influence of adulthood obesity on maximal and submaximal physiological responses during CPET, emphasizing the analysis of submaximal dynamic variables.
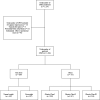
Methods: We analyzed 1,594 CPETs of adults (755 obese participants, Body Mass Index ≥ 30 kg/m2) and compared the obtained variables among non-obese (normal weight and overweight) and obese groups (obesity classes I, II and III) through multivariate covariance analyses.
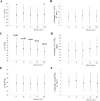
Result: Obesity influenced the majority of evaluated maximal and submaximal responses with worsened CPET performance. Cardiovascular, metabolic and gas exchange variables were the most influenced by obesity. Other maximal and submaximal responses were altered only in morbidly obese. Only a few cardiovascular and ventilatory variables presented inconsistent results. Additionally, Vtmax, [Formula: see text], Vt/Inspiratory Capacity, Vt/Forced Vital Capacity, Lowest [Formula: see text], [Formula: see text], and the y-intercepts of [Formula: see text] did not significantly differ regardless of obesity.
Conclusion: Obesity expressively influences the majority of CPET variables. However, the prognostic values of the main ventilatory efficiency responses remain unchanged. These dynamic responses are not dependent on maximum effort and may be useful in detecting incipient ventilatory disorder. Our results present great practical applicability in identifying exercise limitation, regardless of overweight and obesity.
Conflict of interest statement
We have read the journal’s policy and the authors of this manuscript have the following competing interests: [BBG, TLVDPO, ACBB, ACM, ESF, VZD] have declared that no competing interests exist. [ARTG, RLA, MR] are employees of Angiocorpore. This does not alter our adherence to PLOS ONE policies on sharing data and materials.
Figures


Similar articles
-
Gas exchange efficiency slopes to assess exercise tolerance in chronic obstructive pulmonary disease.BMC Pulm Med. 2024 Oct 31;24(1):550. doi: 10.1186/s12890-024-03312-2. BMC Pulm Med. 2024. PMID: 39482616 Free PMC article.
-
Responses to incremental exercise and the impact of the coexistence of HF and COPD on exercise capacity: a follow-up study.Sci Rep. 2022 Jan 31;12(1):1592. doi: 10.1038/s41598-022-05503-5. Sci Rep. 2022. PMID: 35102201 Free PMC article.
-
Exercise Ventilation in COPD: Influence of Systolic Heart Failure.COPD. 2016 Dec;13(6):693-699. doi: 10.1080/15412555.2016.1174985. Epub 2016 May 12. COPD. 2016. PMID: 27172093
-
Confirming the attainment of maximal oxygen uptake within special and clinical groups: A systematic review and meta-analysis of cardiopulmonary exercise test and verification phase protocols.PLoS One. 2024 Mar 28;19(3):e0299563. doi: 10.1371/journal.pone.0299563. eCollection 2024. PLoS One. 2024. PMID: 38547136 Free PMC article.
-
The association between cardiopulmonary exercise testing and postoperative outcomes in patients with lung cancer undergoing lung resection surgery: A systematic review and meta-analysis.PLoS One. 2023 Dec 7;18(12):e0295430. doi: 10.1371/journal.pone.0295430. eCollection 2023. PLoS One. 2023. PMID: 38060569 Free PMC article.
Cited by
-
A detailed analysis of body composition in relation to cardiopulmonary exercise test indices.Sci Rep. 2024 Sep 16;14(1):21633. doi: 10.1038/s41598-024-72973-0. Sci Rep. 2024. PMID: 39285239 Free PMC article.
-
Obesity and Body Mass Components Influence Exercise Tolerance and the Course of Hypertension in Perimenopausal Women.J Cardiovasc Dev Dis. 2022 Jul 27;9(8):238. doi: 10.3390/jcdd9080238. J Cardiovasc Dev Dis. 2022. PMID: 36005402 Free PMC article.
-
Initial Implementation and Utilization of Cardiopulmonary Exercise Testing at a Pulmonary Department of an Academic Tertiary Care Center: An Overview.J Clin Med. 2025 May 23;14(11):3676. doi: 10.3390/jcm14113676. J Clin Med. 2025. PMID: 40507439 Free PMC article.
-
Invasive Cardiopulmonary Exercise Testing in Chronic Thromboembolic Pulmonary Disease; Obesity and the VE/VCO2 Relationship.J Clin Med. 2024 Dec 17;13(24):7702. doi: 10.3390/jcm13247702. J Clin Med. 2024. PMID: 39768625 Free PMC article.
-
The effect of clinically elevated body mass index on physiological stress during manual lifting activities.PLoS One. 2022 Dec 28;17(12):e0278858. doi: 10.1371/journal.pone.0278858. eCollection 2022. PLoS One. 2022. PMID: 36576923 Free PMC article.
References
-
- Wasserman K, Hansen JE, Sue DY, Stringer SWW, Sietsema KE, Sun XG, et al.. Principles of Exercise Testing and Interpretation. 5th edition. Lippincott Williams & Wilkins; 2011. 2166.
-
- Neder JA, Nery LE. Teste de Exercício Cardiopulmonar [Internet]. Vol. 28, J Pneumol. 2002. [cited 2019 Aug 27]. Available from: http://jornaldepneumologia.com.br/PDF/Suple_140_45_99%20Teste%20do%20exe...
-
- Jones RL, Nzekwu MMU. The effects of body mass index on lung volumes. Chest [Internet]. 2006. [cited 2021 Mar 4];130(3):827–33. Available from: https://pubmed.ncbi.nlm.nih.gov/16963682/ doi: 10.1378/chest.130.3.827 - DOI - PubMed
-
- Salvadori A, Fanari P, Fontana M, Buontempi L, Saezza A, Baudo S, et al.. Oxygen uptake and cardiac performance in obese and normal subjects during exercise. Respiration [Internet]. 1999. [cited 2021 Mar 4];66(1):25–33. Available from: https://pubmed.ncbi.nlm.nih.gov/9973687/ doi: 10.1159/000029333 - DOI - PubMed
-
- Arena R, Cahalin LP. Evaluation of cardiorespiratory fitness and respiratory muscle function in the obese population. Progress in Cardiovascular Diseases [Internet]. 2014. Jan [cited 2021 Mar 4];56(4):457–64. Available from: https://pubmed.ncbi.nlm.nih.gov/24438738/ doi: 10.1016/j.pcad.2013.08.001 - DOI - PubMed

