. 2021 Jul 12;10(7):1425.
doi: 10.3390/plants10071425.

Responses of Grain Yield and Yield Related Parameters to Post-Heading Low-Temperature Stress in Japonica Rice

Affiliations

Responses of Grain Yield and Yield Related Parameters to Post-Heading Low-Temperature Stress in Japonica Rice

Iftikhar Ali et al. Plants (Basel). .

Abstract

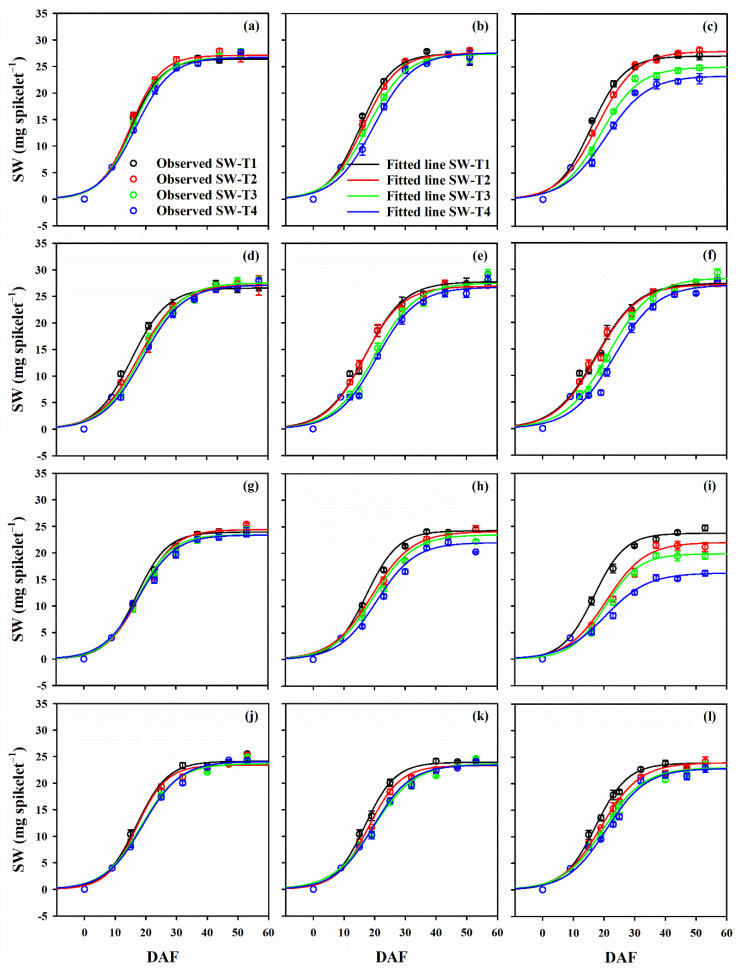
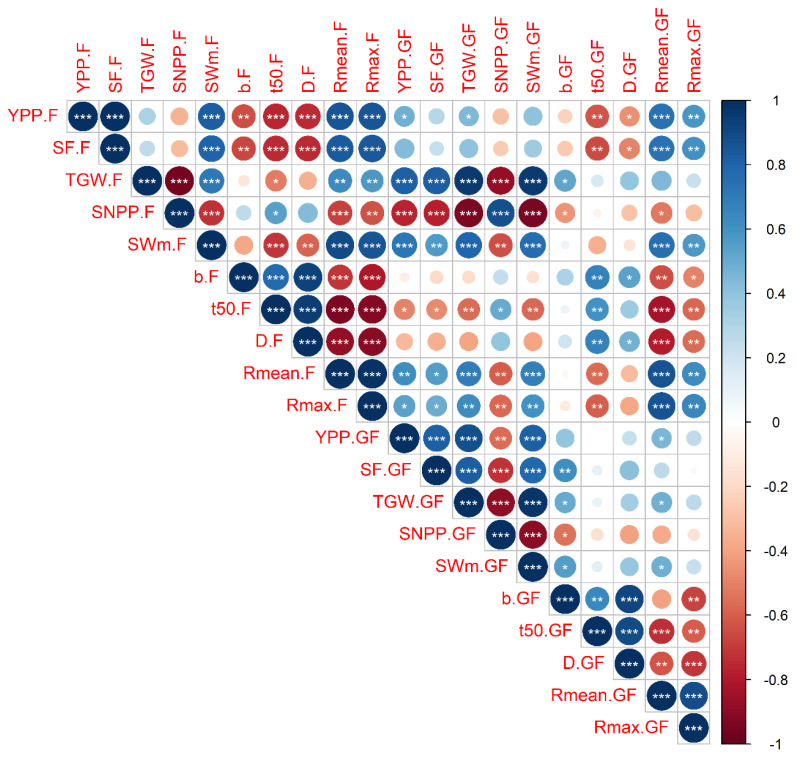
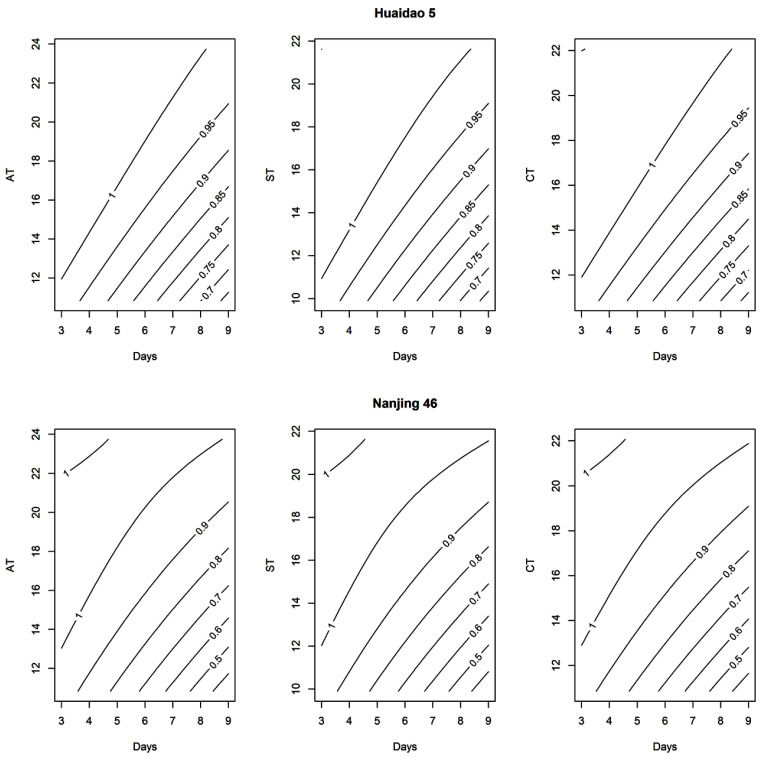
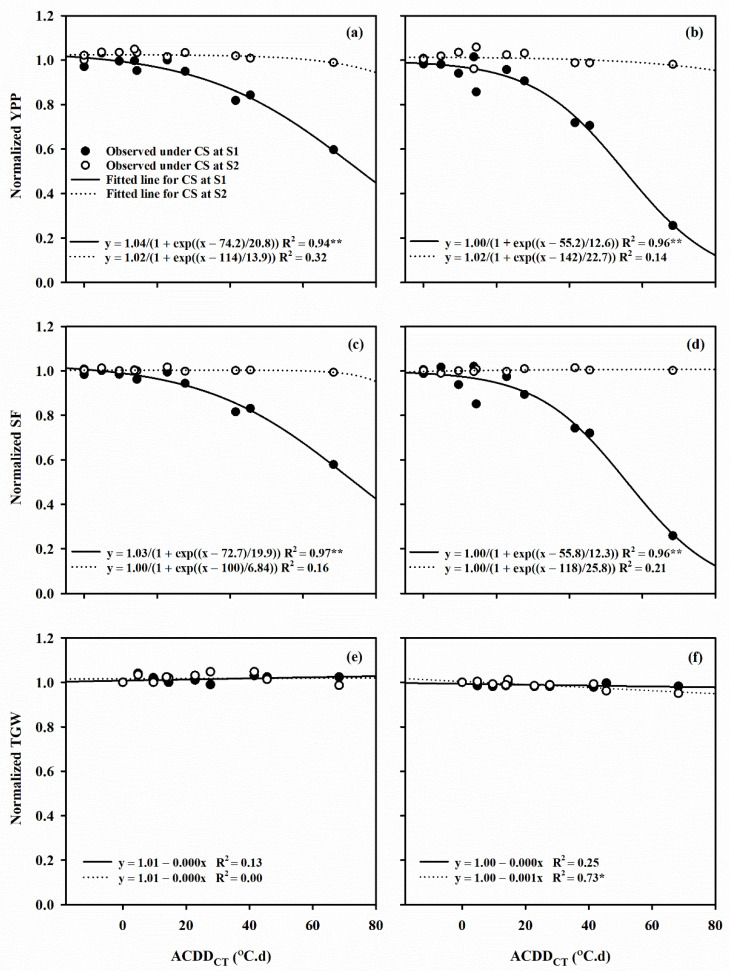
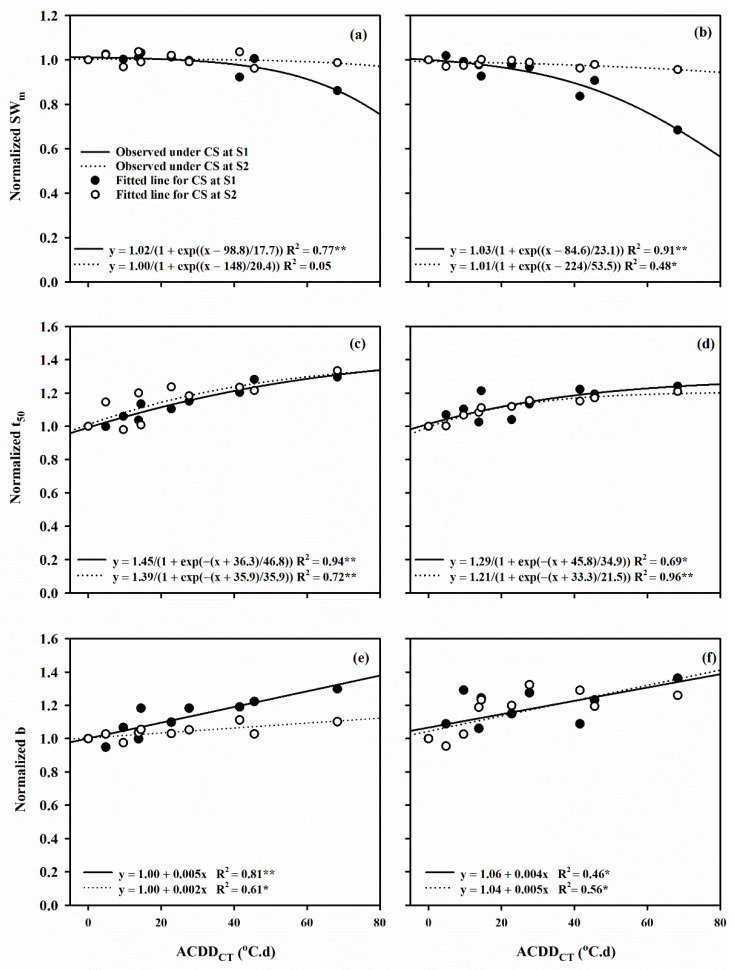
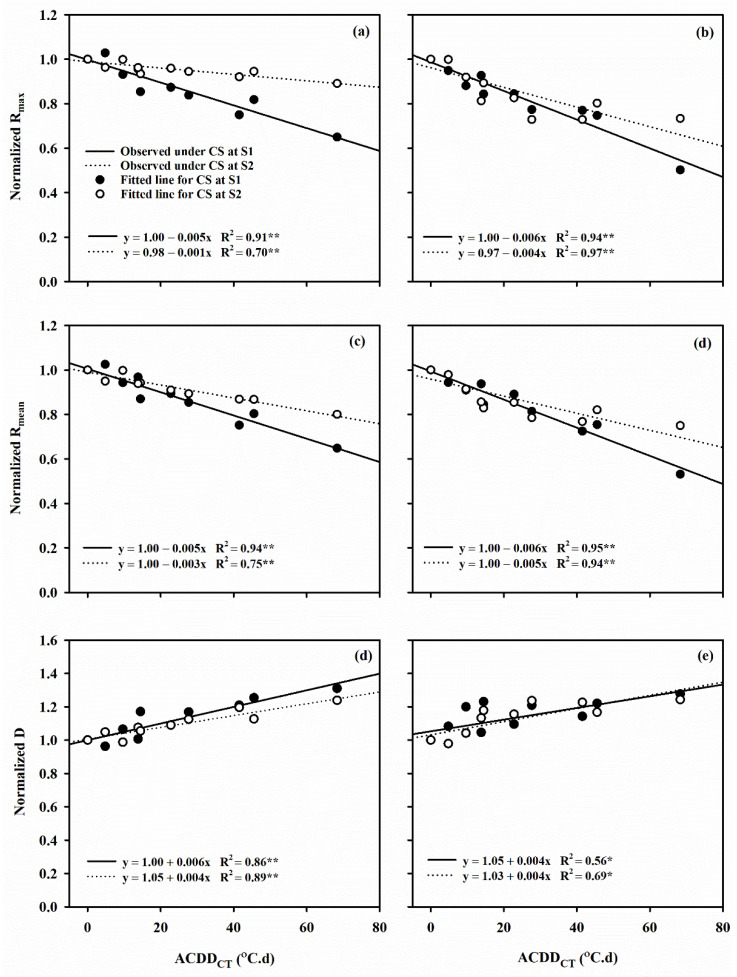
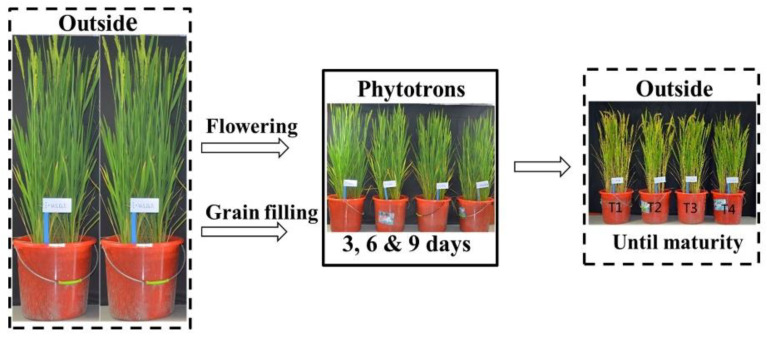
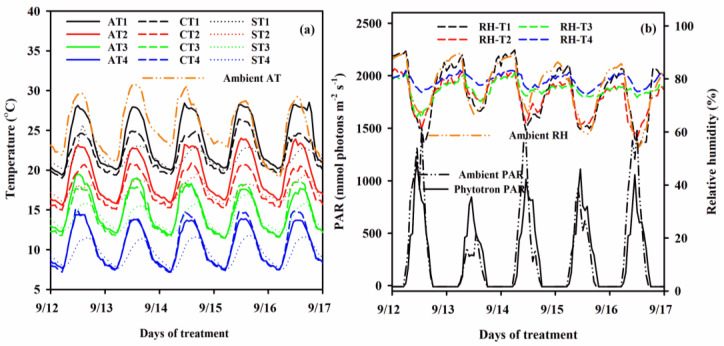
There is unprecedented increase in low-temperature stress (LTS) during post-heading stages in rice as a consequence of the recent climate changes. Quantifying the effect of LTS on yields is key to unraveling the impact of climatic changes on crop production, and therefore developing corresponding mitigation strategies. The present research was conducted to analyze and quantify the effect of post-heading LTS on rice yields as well as yield and grain filling related parameters. A two-year experiment was conducted during rice growing season of 2018 and 2019 using two Japonica cultivars (Huaidao 5 and Nanjing 46) with different low-temperature sensitivities, at four daily minimum/maximum temperature regimes of 21/27 °C (T1), 17/23 °C (T2), 13/19 °C (T3) and 9/15 °C (T4). These temperature treatments were performed for 3 (D1), 6 (D2) or 9 days (D3), at both flowering and grain filling stages. We found LTS for 3 days had no significant effect on grain yield, even when the daily mean temperature was as low as 12 °C. However, LTS of between 6 and 9 days at flowering but not at filling stage significantly reduced grain yield of both cultivars. Comparatively, Huaidao 5 was more cold tolerant than Nanjing 46. LTS at flowering and grain filling stages significantly reduced both maximum and mean grain filling rates. Moreover, LTS prolonged the grain filling duration of both cultivars. Additionally, there was a strong correlation between yield loss and spikelet fertility, spikelet weight at maturity, grain filling duration as well as mean and maximum grain filling rates under post-heading LTS (p < 0.001). Moreover, the effect of post-heading LTS on rice yield can be well quantified by integrating the canopy temperature (CT) based accumulated cold degree days (ACDDCT) with the response surface model. The findings of this research are useful in modeling rice productivity under LTS and for predicting rice productivity under future climates.

Keywords: accumulated cold degree days; canopy temperature; flowering; grain filling; response surface model; rice yield; spikelet fertility.


Conflict of interest statement

The authors declare that the research was conducted in the absence of any commercial or financial relationships that could be construed as a potential conflict of interest.

Figures

Figure 1
Figure 1
The sigmoid relationship of days after flowering (DAF) with spikelet weight (SW) in Huaidao 5 (capital letters panels) and Nanjing 46 (small letters panels) under low-temperature stress (LTS) at the flowering stage (ac) and (gi) grain filling stage (df) and (il) stages. The Tmin/Tmax at T1, T2, T3 and T4 were 21/27, 17/23, 13/19 and 9/15 °C, respectively. Graph (a,d,g,j), (b,e,h,k) and (c,f,i,l) represent LTS durations of 3, 6 and 9 days, respectively. Bars on each symbol show the standard error of means. Observed values of SWm were fitted against DAF using regression analysis.
Figure 2
Figure 2
The Pearson correlation matrix between yield as well as yield and grain filling related parameters under low-temperature stress at flowering (F) and grain filling (GF) stages. (YPP) yield per plant; (SF) spikelet fertility; (TGW) thousand grain weight; (SNPP) spikelet number per panicle; (SWm) spikelet weight at maturity; (b) the shape or steepness of the sigmoid curve; (t50) days from flowering to 50% grain filling; (D) days from flowering to 95% (SWm) (Rmean) grain filling rate; (Rmax) maximum grain filling rate. *, ** and *** represent the significant correlation at p < 0.05, p < 0.01 and p < 0.001, respectively.
Figure 3
Figure 3
Contour plots for relative change in yield per plant (YPP) under decreasing low air temperature (AT), soil temperature (ST) and canopy temperature (CT) with increasing low-temperature stress (LTS) duration at flowering stage in Huaidao 5 and Nanjing 46.
Figure 4
Figure 4
The relationship between the change in canopy temperature based accumulated cold degree days (ACDDCT) and the relative change in (a,b) yield per plant (YPP), (c,d) spikelet fertility (SF), (e,f) thousand grain weight (TGW) in Huaidao 5 and Nanjing 46, respectively. (S1) flowering stage; (S2) grain filling stage. Capital letters represent Huaidao 5 whereas the small letters represent Nanjing 46. ** represents p < 0.01; * represents p < 0.05).
Figure 5
Figure 5
The relationship between the change in canopy temperature based accumulated cold degree days (ACDDCT) and the relative change in (a,b) spikelet weight at maturity (SWm), (c,d) days from flowering to 50% grain filling (t50), (e,f) shape or steepness of curve (b) in Huaidao 5 and Nanjing 46, respectively. (S1) Flowering stage; (S2) grain filling stage. Capital letters represent Huaidao 5 whereas the small letters represent Nanjing 46. ** represents p < 0.01; * represents p < 0.05).
Figure 6
Figure 6
The relationship between the change in canopy temperature based accumulated cold degree days (ACDDCT) and the relative change in (a,b) maximum filling rate (Rmax), (c,d) mean filling rate (Rmean) and (e,f) total days from flowering to 95% SWm (D) in Huaidao 5 and Nanjing 46, respectively. (S1) Flowering stage; (S2) grain filling stage. Capital letters represent Huaidao 5 whereas the small letters represent Nanjing 46. ** represents p < 0.01; * represents p < 0.05).
Figure 7
Figure 7
Pictorial view of the experiment design. T1, T2, T3 and T4 are temperature levels. The Tmin/Tmax of T1, T2, T3 and T4 were 21/27, 17/23, 13/19 and 9/15 °C, respectively.
Figure 8
Figure 8
The (a) diurnal air (solid lines), canopy (broken lines) and soil temperatures (dotted lines) and (b) relative humidity (RH) (broken lines) and incident photosynthetically active radiations (PAR) (solid line) during low temperature treatment episodes in the phytotrons. Double dotted lines represent the ambient AT, PAR and RH of the same days.

References

    1. Shelton A.M., Zhao J.-Z., Roush R.T. Economic, Ecological, Food Safety, and Social Consequences of the Deployment of Bt. Transgenic Plants. Ann. Rev. Entomol. 2002;47:845–881. doi: 10.1146/annurev.ento.47.091201.145309. - DOI - PubMed
    1. Yoshida S. Fundamentals of Rice Crop Science. International Rice Research Institute; Los Baños, Philippines: 1981. pp. 65–109.
    1. Shimono H., Hasegawa T., Iwama K. Response of Growth and Grain Yield in Paddy Rice to Cool Water at Different Growth Stages. Field Crop. Res. 2002;73:67–79. doi: 10.1016/S0378-4290(01)00184-8. - DOI
    1. Galiba G., Tóth B. Cold Stress. In: Brian T., Brian G.M., Denis J.M., editors. Encyclopedia of Applied Plant Sciences. 2nd ed. Academic Press; Cambridge, MA, USA: London, UK: 2016. pp. 1–7. - DOI
    1. Huang X., Kurata N., Wei X., Wang Z.X., Wang A., Zhao Q., Zhao Y., Liu K., Lu H., Li W., et al. A Map of Rice Genome Variation Reveals the Origin of Cultivated Rice. Nature. 2012;490:497–501. doi: 10.1038/nature11532. - DOI - PMC - PubMed

LinkOut - more resources