. 2021 Aug 3;13(15):2577.
doi: 10.3390/polym13152577.

Biomimetic Hierarchical Structuring of PLA by Ultra-Short Laser Pulses for Processing of Tissue Engineered Matrices: Study of Cellular and Antibacterial Behavior

Affiliations

Biomimetic Hierarchical Structuring of PLA by Ultra-Short Laser Pulses for Processing of Tissue Engineered Matrices: Study of Cellular and Antibacterial Behavior

Albena Daskalova et al. Polymers (Basel). .

Abstract

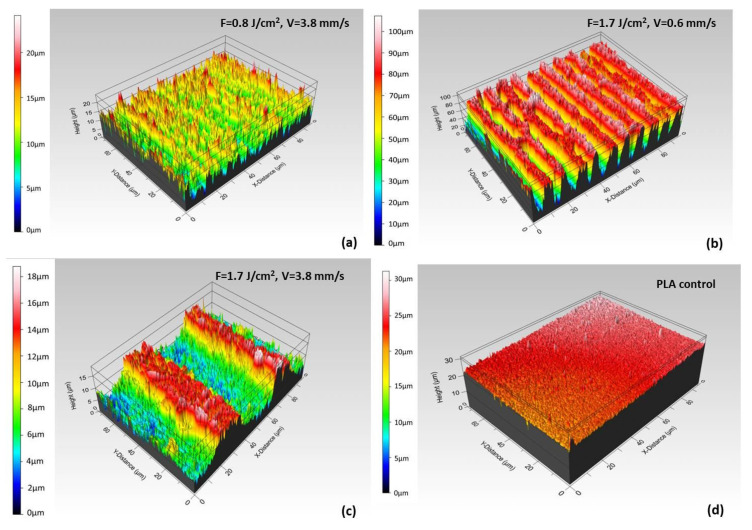
The influence of ultra-short laser modification on the surface morphology and possible chemical alteration of poly-lactic acid (PLA) matrix in respect to the optimization of cellular and antibacterial behavior were investigated in this study. Scanning electron microscopy (SEM) morphological examination of the processed PLA surface showed the formation of diverse hierarchical surface microstructures, generated by irradiation with a range of laser fluences (F) and scanning velocities (V) values. By controlling the laser parameters, diverse surface roughness can be achieved, thus influencing cellular dynamics. This surface feedback can be applied to finely tune and control diverse biomaterial surface properties like wettability, reflectivity, and biomimetics. The triggering of thermal effects, leading to the ejection of material with subsequent solidification and formation of raised rims and 3D-like hollow structures along the processed zones, demonstrated a direct correlation to the wettability of the PLA. A transition from superhydrophobic (θ > 150°) to super hydrophilic (θ < 20°) surfaces can be achieved by the creation of grooves with V = 0.6 mm/s, F = 1.7 J/cm2. The achieved hierarchical architecture affected morphology and thickness of the processed samples which were linked to the nature of ultra-short laser-material interaction effects, namely the precipitation of temperature distribution during material processing can be strongly minimized with ultrashort pulses leading to non-thermal and spatially localized effects that can facilitate volume ablation without collateral thermal damage The obtained modification zones were analyzed employing Fourier transform infrared (FTIR), X-ray photoelectron spectroscopy (XPS), Energy dispersive X-ray analysis (EDX), and optical profilometer. The modification of the PLA surface resulted in an increased roughness value for treatment with lower velocities (V = 0.6 mm/s). Thus, the substrate gains a 3D-like architecture and forms a natural matrix by microprocessing with V = 0.6 mm/s, F = 1.7 J/cm2, and V = 3.8 mm/s, F = 0.8 J/cm2. The tests performed with Mesenchymal stem cells (MSCs) demonstrated that the ultra-short laser surface modification altered the cell orientation and promoted cell growth. The topographical design was tested also for the effectiveness of bacterial attachment concerning chosen parameters for the creation of an array with defined geometrical patterns.

Keywords: Fs bioscaffolds structuring; PLA texturing; cell matrices; temporal scaffolds; tissue engineering; ultra-short functionalization of cell matrices.


Conflict of interest statement

The authors declare no conflict of interest.

Figures

Figure 1
Figure 1
A scheme of the optical setup for Fs laser patterning of PLA sample positioned perpendicular to the laser beam on XYZ translation stage.
Figure 2
Figure 2
Experimental setup for measuring the water contact angle (WCA) of PLA samples.
Figure 3
Figure 3
Preparation procedure of cell culture studies.
Figure 4
Figure 4
Cell viability test performed at day 7, day 10 and day 14.
Figure 5
Figure 5
Scheme of the used microbiology protocol.
Figure 6
Figure 6
SEM images of PLA matrices: (ad) patterned with F = 0.8 J/cm2 and V = 16, 3.8, 1.7, 0.6 mm/s, respectively (eh) and F = 1.7 J/cm2 and V = 16, 3.8, 1.7, 0.6 mm/s respectively.
Figure 7
Figure 7
Representative 3D cross section images of PLA matrices: (a) F = 0.8 J/cm2, V = 3.8 mm/s, (b) F = 1.7 J/cm2, V = 0.6 mm/s, (c) F = 1.7 J/cm2, V = 3.8 mm/s; (d) control surface.
Figure 8
Figure 8
Scheme of water droplet positioning of Fs modified PLA samples: (a) perpendicular to the laser created grooves and (b) along the laser created grooves.
Figure 9
Figure 9
WCA evaluation of Fs modified PLA samples for a period of 7 s—(a) the dH2O drop applied along the direction of the grooves; (b) the dH2O drop applied perpendicular to the direction of created grooves.
Figure 10
Figure 10
FTIR spectrum obtained for laser structured PLA surfaces treated by laser irradiation at F = 0.8 and 1.7 J/cm2, V = 16, 3.8, 1.7 and 0.6 mm/s.
Figure 11
Figure 11
PCA scores scatter plots of FTIR spectra in the region from 600—4600 cm−1; (a) V1—F = 1.663 J/cm2, V = 1.7 mm/s; V2—F = 1.663 J/cm2, V = 3.8 mm/s; V3—F = 1.663 J/cm2, V = 16 mm/s; V4—F = 0.831 J/cm2, V = 6.0 mm/s; V5—F = 0.831 J/cm2, V = 1.7 mm/s; V6—F = 0.831 J/cm2, V = 16 mm/s; V7—F = 0.831 J/cm2, V = 3.8 mm/s; V8—F = 1.663 J/cm2, V = 0.6 mm/s; (b) The Summary of plot fit of the PCA model for component R2 and Q2.
Figure 12
Figure 12
Comparison of XPS spectra of PLA surfaces treated by laser irradiation at F = 0.8 J/cm2, V = 3.8 mm/s and F = 1.7 J/cm2, V = 0.6 mm/s; (a) Wide XPS Spectra; (b) C1s spectra; (c) C1s decomposed spectra; (d) O1s spectra.
Figure 13
Figure 13
(a) Graphical presentation of pH change of PBS of Group1, 2 and 3 over time; (b) SEM images of G1, (c) G2 samples after the in vitro degradation test.
Figure 14
Figure 14
Number of adhered S. aureus bacteria on the grooved PLA samples surface (G2—PLA F = 1.7 J/cm2, V = 0.6 mm/s; G3—control PLA samples).
Figure 15
Figure 15
MSCs proliferation rate (a) and fluorescence images of morphology cellular cytoskeleton (b) on G1, G2 and G3 matrices. cellular cytoskeleton (in green) and nuclei (in blue). Scale bars = 50 µm.

References

    1. World Population Prospects: The 2019 Revision. United Nations DESA/Population Division. 2019. [(accessed on 26 March 2021)]; Available online: https://population.un.org/wpp/
    1. Langer R. Tissue engineering. Mol. Ther. 2000;1:12–15. doi: 10.1006/mthe.1999.0003. - DOI - PubMed
    1. Scheinpflug J., Pfeiffenberger M., Damerau A., Schwarz F., Textor M., Lang A., Schulze F. Journey into Bone Models: A Review. Genes. 2018;9:247. doi: 10.3390/genes9050247. - DOI - PMC - PubMed
    1. Bose S., Roy M., Bandyopadhyay A. Recent advances in bone tissue engineering scaffolds. Trends Biotechnol. 2012;30:546–554. doi: 10.1016/j.tibtech.2012.07.005. - DOI - PMC - PubMed
    1. Hutmacher D.W., Schantz J.T., Lam C.X.F., Tan K.C., Lim T.C. State of the art and future directions of scaffold-based bone engineering from a biomaterials perspective. J. Tissue Eng. Regener. Med. 2007;1:245–260. doi: 10.1002/term.24. - DOI - PubMed

LinkOut - more resources