

Machine Learning Approach for Fatigue Estimation in Sit-to-Stand Exercise
- PMID: 34372241
- PMCID: PMC8348066
- DOI: 10.3390/s21155006
Machine Learning Approach for Fatigue Estimation in Sit-to-Stand Exercise
Abstract
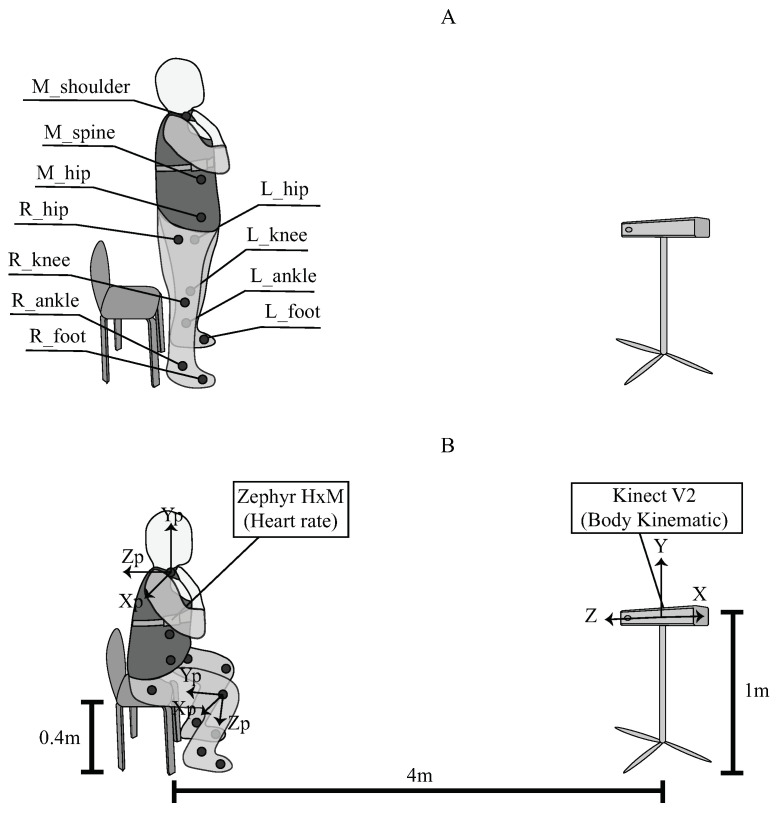
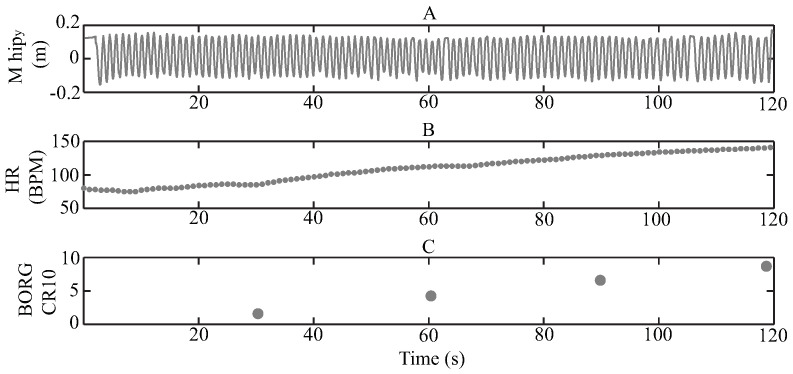
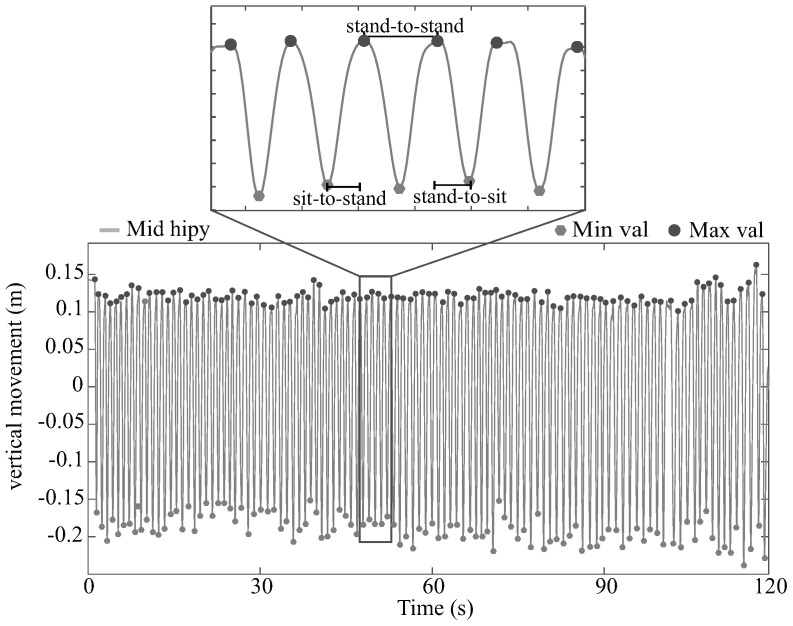
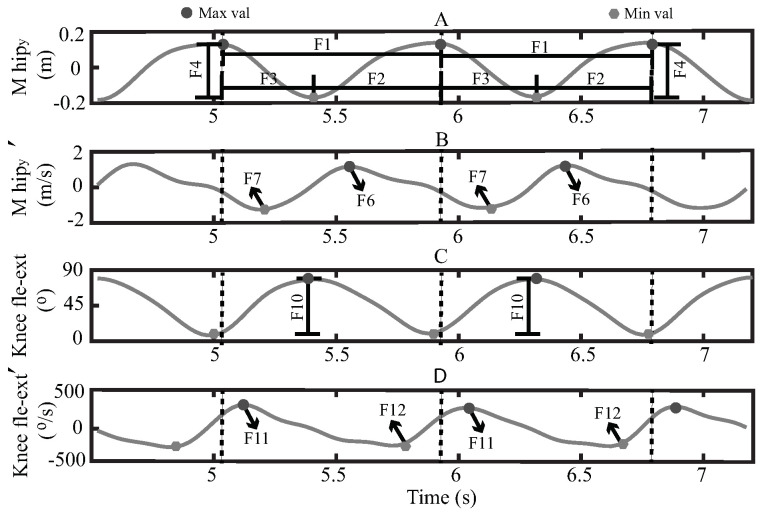
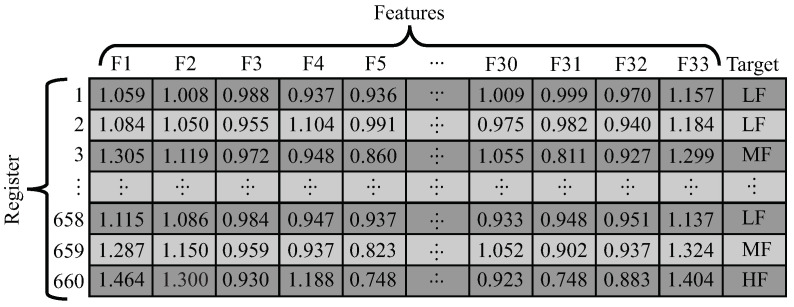
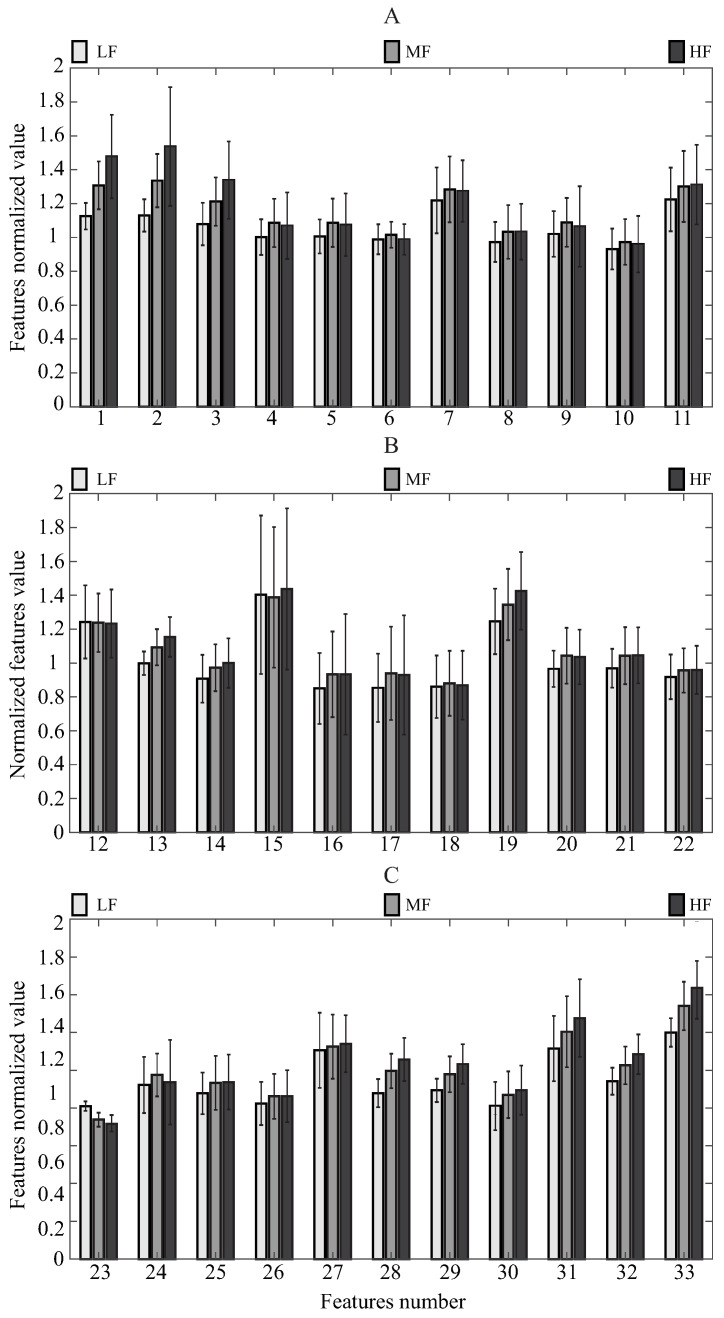
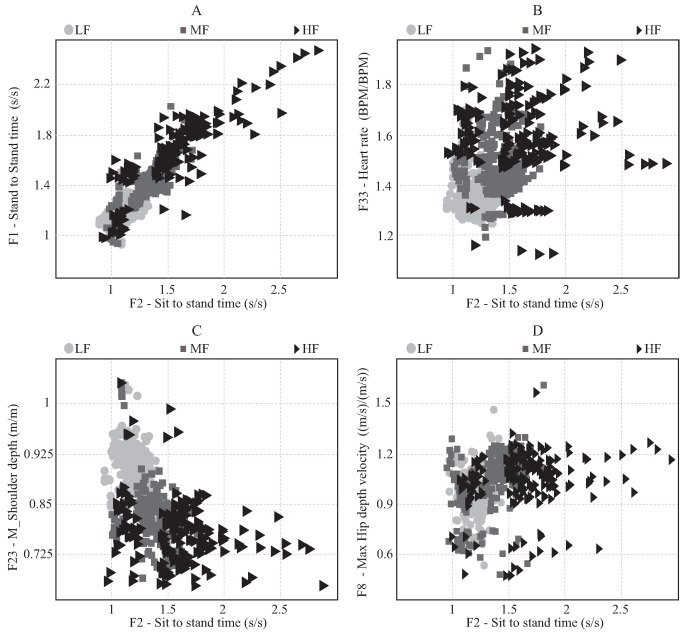
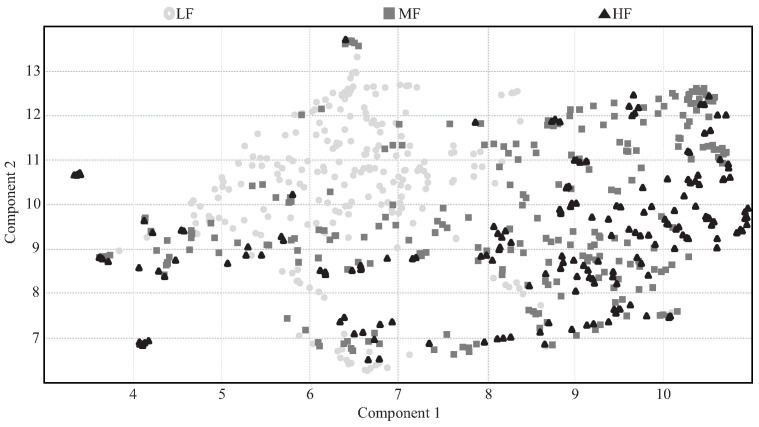
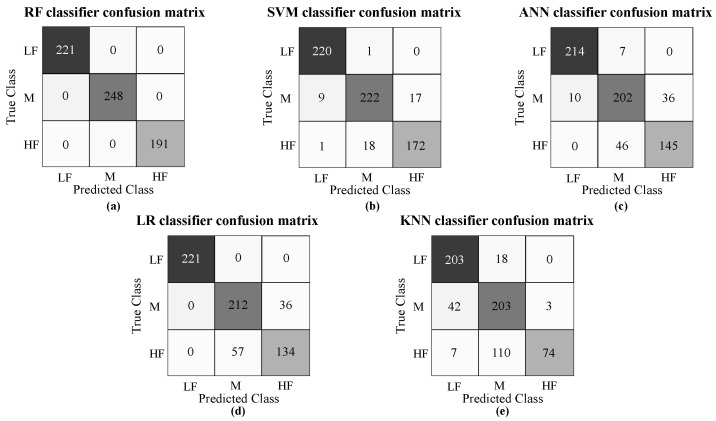
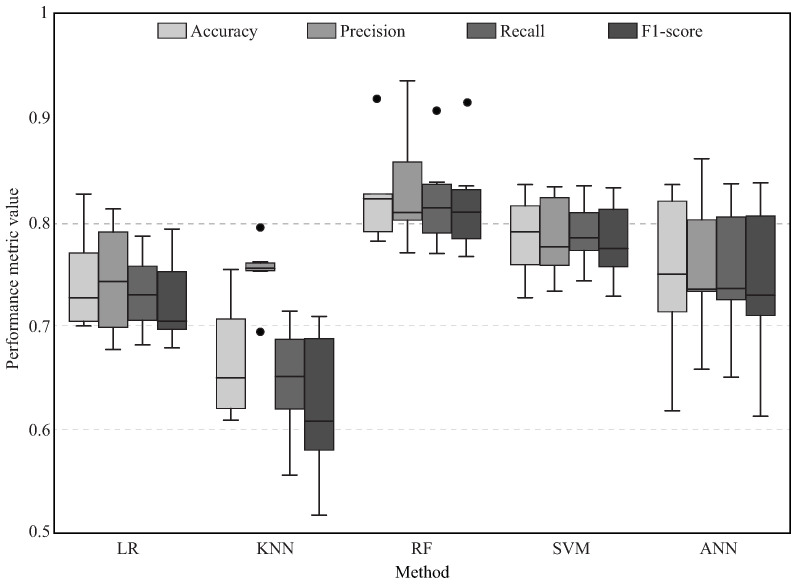
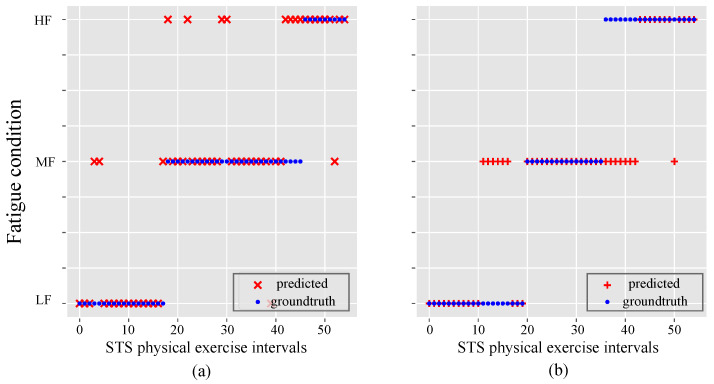
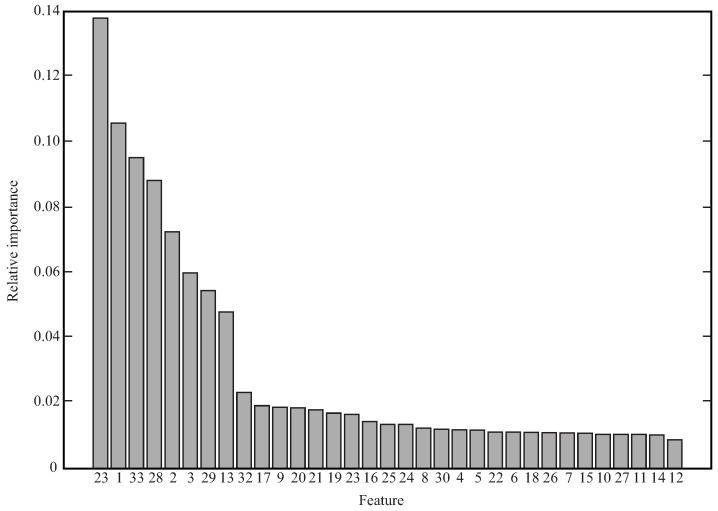
Physical exercise (PE) has become an essential tool for different rehabilitation programs. High-intensity exercises (HIEs) have been demonstrated to provide better results in general health conditions, compared with low and moderate-intensity exercises. In this context, monitoring of a patients' condition is essential to avoid extreme fatigue conditions, which may cause physical and physiological complications. Different methods have been proposed for fatigue estimation, such as: monitoring the subject's physiological parameters and subjective scales. However, there is still a need for practical procedures that provide an objective estimation, especially for HIEs. In this work, considering that the sit-to-stand (STS) exercise is one of the most implemented in physical rehabilitation, a computational model for estimating fatigue during this exercise is proposed. A study with 60 healthy volunteers was carried out to obtain a data set to develop and evaluate the proposed model. According to the literature, this model estimates three fatigue conditions (low, moderate, and high) by monitoring 32 STS kinematic features and the heart rate from a set of ambulatory sensors (Kinect and Zephyr sensors). Results show that a random forest model composed of 60 sub-classifiers presented an accuracy of 82.5% in the classification task. Moreover, results suggest that the movement of the upper body part is the most relevant feature for fatigue estimation. Movements of the lower body and the heart rate also contribute to essential information for identifying the fatigue condition. This work presents a promising tool for physical rehabilitation.
Keywords: Kinect; fatigue estimation; machine learning; physical exercise; physical rehabilitation; sit-to-stand.
Conflict of interest statement
The authors declare no conflict of interest. The funding sponsors had no role in the design of the study, in the collection, analyses, or interpretation of data, in the writing of the manuscript, and in the decision to publish the results.
Figures


Similar articles
-
Machine Learning Approach to Model Physical Fatigue during Incremental Exercise among Firefighters.Sensors (Basel). 2022 Dec 24;23(1):194. doi: 10.3390/s23010194. Sensors (Basel). 2022. PMID: 36616791 Free PMC article.
-
A Data-Driven Approach to Physical Fatigue Management Using Wearable Sensors to Classify Four Diagnostic Fatigue States.Sensors (Basel). 2021 Sep 25;21(19):6401. doi: 10.3390/s21196401. Sensors (Basel). 2021. PMID: 34640722 Free PMC article.
-
Feasibility study: Towards Estimation of Fatigue Level in Robot-Assisted Exercise for Cardiac Rehabilitation.IEEE Int Conf Rehabil Robot. 2019 Jun;2019:911-916. doi: 10.1109/ICORR.2019.8779460. IEEE Int Conf Rehabil Robot. 2019. PMID: 31374746
-
Sit-to-stand exercise programs improve sit-to-stand performance in people with physical impairments due to health conditions: a systematic review and meta-analysis.Disabil Rehabil. 2020 May;42(9):1202-1211. doi: 10.1080/09638288.2018.1524518. Epub 2019 Jan 22. Disabil Rehabil. 2020. PMID: 30668164
-
A review of computational approaches for evaluation of rehabilitation exercises.Comput Biol Med. 2020 Apr;119:103687. doi: 10.1016/j.compbiomed.2020.103687. Epub 2020 Mar 4. Comput Biol Med. 2020. PMID: 32339122 Free PMC article. Review.
Cited by
-
Machine Learning Approach to Model Physical Fatigue during Incremental Exercise among Firefighters.Sensors (Basel). 2022 Dec 24;23(1):194. doi: 10.3390/s23010194. Sensors (Basel). 2022. PMID: 36616791 Free PMC article.
-
A Data-Driven Approach to Physical Fatigue Management Using Wearable Sensors to Classify Four Diagnostic Fatigue States.Sensors (Basel). 2021 Sep 25;21(19):6401. doi: 10.3390/s21196401. Sensors (Basel). 2021. PMID: 34640722 Free PMC article.
-
A dataset for fatigue estimation during shoulder internal and external rotation movements using wearables.Sci Data. 2024 Apr 27;11(1):433. doi: 10.1038/s41597-024-03254-8. Sci Data. 2024. PMID: 38678019 Free PMC article.
-
Exploring the Applicability of Physiological Monitoring to Manage Physical Fatigue in Firefighters.Sensors (Basel). 2023 May 27;23(11):5127. doi: 10.3390/s23115127. Sensors (Basel). 2023. PMID: 37299854 Free PMC article.
-
A Pilot Study of Plantar Mechanics Distributions and Fatigue Profiles after Running on a Treadmill: Using a Support Vector Machine Algorithm.J Healthc Eng. 2023 Feb 21;2023:7461729. doi: 10.1155/2023/7461729. eCollection 2023. J Healthc Eng. 2023. PMID: 36890878 Free PMC article.
References
-
- World Health Organization . Global Status Report on Noncommunicable Diseases 2014. World Health Organization; Geneva, Switzerland: 2014. Number WHO/NMH/NVI/15.1.
-
- Pedersen B.K. Nutrition and Skeletal Muscle. Elsevier; Amsterdam, The Netherlands: 2019. Physical Exercise in Chronic Diseases; pp. 217–266. - DOI
MeSH terms
Grants and funding
LinkOut - more resources
Full Text Sources
Medical
