

Bundibugyo ebolavirus Survival Is Associated with Early Activation of Adaptive Immunity and Reduced Myeloid-Derived Suppressor Cell Signaling
- PMID: 34372693
- PMCID: PMC8406165
- DOI: 10.1128/mBio.01517-21
Bundibugyo ebolavirus Survival Is Associated with Early Activation of Adaptive Immunity and Reduced Myeloid-Derived Suppressor Cell Signaling
Abstract
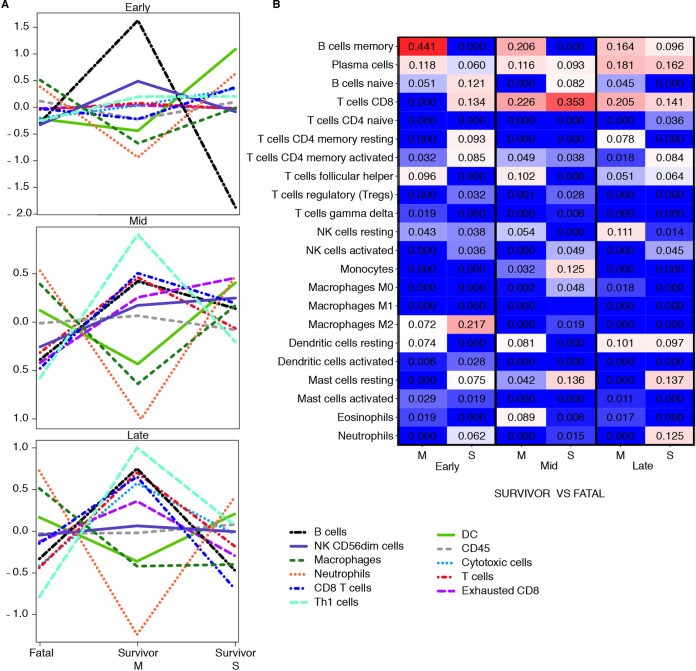
Ebolaviruses Bundibugyo virus (BDBV) and Ebola virus (EBOV) cause fatal hemorrhagic disease in humans and nonhuman primates. While the host response to EBOV is well characterized, less is known about BDBV infection. Moreover, immune signatures that mediate natural protection against all ebolaviruses remain poorly defined. To explore these knowledge gaps, we transcriptionally profiled BDBV-infected rhesus macaques, a disease model that results in incomplete lethality. This approach enabled us to identify prognostic indicators. As expected, survival (∼60%) correlated with reduced clinical pathology and circulating infectious virus, although peak viral RNA loads were not significantly different between surviving and nonsurviving macaques. Survivors had higher anti-BDBV antibody titers and transcriptionally derived cytotoxic T cell-, memory B cell-, and plasma cell-type quantities, demonstrating activation of adaptive immunity. Conversely, a poor prognosis was associated with lack of an appropriate adaptive response, sustained innate immune signaling, and higher expression of myeloid-derived suppressor cell (MDSC)-related transcripts (S100A8, S100A9, CEBPB, PTGS2, CXCR1, and LILRA3). MDSCs are potent immunosuppressors of cellular and humoral immunity, and therefore, they represent a potential therapeutic target. Circulating plasminogen activator inhibitor 1 (PAI-1) and tissue plasminogen activator (tPA) levels were also elevated in nonsurvivors and in survivors exhibiting severe illness, emphasizing the importance of maintaining coagulation homeostasis to control disease progression. IMPORTANCE Bundibugyo virus (BDBV) and Ebola virus (EBOV) are ebolaviruses endemic to Africa that cause severe, often fatal hemorrhagic disease. BDBV is considered a less pathogenic ebolavirus due to its reduced lethality during human outbreaks, as well as in experimentally infected nonhuman primates. The reduced mortality of BDBV in NHP models, resulting in a pool of survivors, afforded us the unique opportunity of identifying immune correlates that confer protection against ebolaviruses. In this study, we discovered that the survival of BDBV-infected nonhuman primates (NHPs) was dependent on early development of adaptive (memory) immune responses and reduced myeloid-derived suppressor cell (MDSC)-related signaling. MDSCs are a heterogenous group of immune cells implicated in a number of diseases that are powerful immunosuppressors of cellular and humoral immunity. Thus, MDSCs represent a novel therapeutic target to prevent ebolavirus disease. To our knowledge, this is the first study to link increased morbidity with recruitment of these potent immunosuppressive cells.
Keywords: Ebola virus; coagulation; filovirus; immunology; myeloid-derived suppressor cell; nonhuman primate; pathogenesis.
Figures
Similar articles
-
A Recombinant Vesicular Stomatitis Virus-Based Vaccine Provides Postexposure Protection Against Bundibugyo Ebolavirus Infection.J Infect Dis. 2023 Nov 15;228(Suppl 7):S712-S720. doi: 10.1093/infdis/jiad207. J Infect Dis. 2023. PMID: 37290053 Free PMC article.
-
Ferrets Infected with Bundibugyo Virus or Ebola Virus Recapitulate Important Aspects of Human Filovirus Disease.J Virol. 2016 Sep 29;90(20):9209-23. doi: 10.1128/JVI.01033-16. Print 2016 Oct 15. J Virol. 2016. PMID: 27489269 Free PMC article.
-
Transcriptional Analysis of Lymphoid Tissues from Infected Nonhuman Primates Reveals the Basis for Attenuation and Immunogenicity of an Ebola Virus Encoding a Mutant VP35 Protein.J Virol. 2021 Feb 24;95(6):e01995-20. doi: 10.1128/JVI.01995-20. Print 2021 Feb 24. J Virol. 2021. PMID: 33408171 Free PMC article.
-
Nonhuman Primate Models of Ebola Virus Disease.Curr Top Microbiol Immunol. 2017;411:171-193. doi: 10.1007/82_2017_20. Curr Top Microbiol Immunol. 2017. PMID: 28643203 Review.
-
The Ebola virus glycoprotein and its immune responses across multiple vaccine platforms.Expert Rev Vaccines. 2020 Mar;19(3):267-277. doi: 10.1080/14760584.2020.1738225. Epub 2020 Mar 16. Expert Rev Vaccines. 2020. PMID: 32129120 Review.
Cited by
-
Expansion of myeloid suppressor cells and suppression of Lassa virus-specific T cells during fatal Lassa fever.PLoS Pathog. 2025 Apr 17;21(4):e1013111. doi: 10.1371/journal.ppat.1013111. eCollection 2025 Apr. PLoS Pathog. 2025. PMID: 40245043 Free PMC article.
-
Recombinant vesicular stomatitis virus-vectored vaccine induces long-lasting immunity against Nipah virus disease.J Clin Invest. 2023 Feb 1;133(3):e164946. doi: 10.1172/JCI164946. J Clin Invest. 2023. PMID: 36445779 Free PMC article.
-
Pathogenic differences of cynomolgus macaques after Taï Forest virus infection depend on the viral stock propagation.PLoS Pathog. 2024 Jun 11;20(6):e1012290. doi: 10.1371/journal.ppat.1012290. eCollection 2024 Jun. PLoS Pathog. 2024. PMID: 38861571 Free PMC article.
-
A Recombinant Vesicular Stomatitis Virus-Based Vaccine Provides Postexposure Protection Against Bundibugyo Ebolavirus Infection.J Infect Dis. 2023 Nov 15;228(Suppl 7):S712-S720. doi: 10.1093/infdis/jiad207. J Infect Dis. 2023. PMID: 37290053 Free PMC article.
-
Depletion of Bone Marrow Hematopoietic Cells in Ebolavirus-Infected Rhesus Macaques: A Possible Cause of Hematologic Abnormalities in Ebolavirus Disease.Am J Pathol. 2023 Dec;193(12):2031-2046. doi: 10.1016/j.ajpath.2023.08.010. Epub 2023 Sep 7. Am J Pathol. 2023. PMID: 37689386 Free PMC article.
References
-
- Kuhn JH, Amarasinghe GK, Basler CF, Bavari S, Bukreyev A, Chandran K, Crozier I, Dolnik O, Dye JM, Formenty PBH, Griffiths A, Hewson R, Kobinger GP, Leroy EM, Mühlberger E, Netesov SV, Palacios G, Pályi B, Pawęska JT, Smither SJ, Takada A, Towner JS, Wahl V, ICTV Report Consortium . 2019. ICTV virus taxonomy profile: Filoviridae. J Gen Virol 100:911–912. doi:10.1099/jgv.0.001252. - DOI - PMC - PubMed
-
- World Health Organization. Ebola—Democratic Republic of the Congo. Disease Outbreak News, 10 February 2021. World Health Organization, Geneva, Switzerland. https://www.who.int/emergencies/disease-outbreak-news/item/2021-DON310. Accessed 1 March 2021.
-
- World Health Organization. Ebola—Guinea. Disease Outbreak News, 17 February 2021. Geneva, Switzerland: World Health Organization. https://www.who.int/emergencies/disease-outbreak-news/item/2021-DON312. Accessed 1 March 2021.
-
- Feldmann H, Sanchez A, Geisbert TW. 2013. Chapter 32. Filoviridae: Ebola and Marburg viruses. In Knipe DM, Howley PM, Cohen JI, Griffin DE, Lamb RA, Martin MA, Racaniello VR, Roizman B (ed), Fields virology, 6th ed. Lippincott, Williams, & Wilkins, Philadelphia, PA.
Publication types
MeSH terms
Substances
Grants and funding
LinkOut - more resources
Full Text Sources
Other Literature Sources
Medical
Research Materials
Miscellaneous
