. 2021 Aug 31;12(4):e0157221.
doi: 10.1128/mBio.01572-21. Epub 2021 Aug 10.

Unfolded Protein Response Inhibition Reduces Middle East Respiratory Syndrome Coronavirus-Induced Acute Lung Injury

Affiliations

Unfolded Protein Response Inhibition Reduces Middle East Respiratory Syndrome Coronavirus-Induced Acute Lung Injury

Amy C Sims et al. mBio. .

Abstract

Tissue- and cell-specific expression patterns are highly variable within and across individuals, leading to altered host responses after acute virus infection. Unraveling key tissue-specific response patterns provides novel opportunities for defining fundamental mechanisms of virus-host interaction in disease and the identification of critical tissue-specific networks for disease intervention in the lung. Currently, there are no approved therapeutics for Middle East respiratory syndrome coronavirus (MERS-CoV) patients, and little is understood about how lung cell types contribute to disease outcomes. MERS-CoV replicates equivalently in primary human lung microvascular endothelial cells (MVE) and fibroblasts (FB) and to equivalent peak titers but with slower replication kinetics in human airway epithelial cell cultures (HAE). However, only infected MVE demonstrate observable virus-induced cytopathic effect. To explore mechanisms leading to reduced MVE viability, donor-matched human lung MVE, HAE, and FB were infected, and their transcriptomes, proteomes, and lipidomes were monitored over time. Validated functional enrichment analysis demonstrated that MERS-CoV-infected MVE were dying via an unfolded protein response (UPR)-mediated apoptosis. Pharmacologic manipulation of the UPR in MERS-CoV-infected primary lung cells reduced viral titers and in male mice improved respiratory function with accompanying reductions in weight loss, pathological signatures of acute lung injury, and times to recovery. Systems biology analysis and validation studies of global kinetic transcript, protein, and lipid data sets confirmed that inhibition of host stress pathways that are differentially regulated following MERS-CoV infection of different tissue types can alleviate symptom progression to end-stage lung disease commonly seen following emerging coronavirus outbreaks. IMPORTANCE Middle East respiratory syndrome coronavirus (MERS-CoV) causes severe atypical pneumonia in infected individuals, but the underlying mechanisms of pathogenesis remain unknown. While much has been learned from the few reported autopsy cases, an in-depth understanding of the cells targeted by MERS-CoV in the human lung and their relative contribution to disease outcomes is needed. The host response in MERS-CoV-infected primary human lung microvascular endothelial (MVE) cells and fibroblasts (FB) was evaluated over time by analyzing total RNA, proteins, and lipids to determine the cellular pathways modulated postinfection. Findings revealed that MERS-CoV-infected MVE cells die via apoptotic mechanisms downstream of the unfolded protein response (UPR). Interruption of enzymatic processes within the UPR in MERS-CoV-infected male mice reduced disease symptoms, virus-induced lung injury, and time to recovery. These data suggest that the UPR plays an important role in MERS-CoV infection and may represent a host target for therapeutic intervention.

Keywords: MERS-CoV; acute lung injury; apoptosis; fibroblasts; microvascular endothelial cells; primary human lung cells; unfolded protein response.


Figures
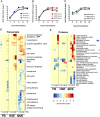
FIG 1
FIG 1
Transcriptomics and proteomics suggest activation of unfolded protein response and apoptotic pathways in MERS-CoV-infected primary human lung microvascular endothelial cells but not in infected airway epithelial cell cultures or fibroblasts. (A to C) Viral replication. Donor-matched microvascular endothelial cells (MVE), human airway epithelial cell cultures (HAE), and fibroblasts (FB) were infected with wild-type MERS-CoV (MOI of 5), and supernatants were collected at the indicated times and viral titers determined by plaque assay. Results are shown as plaque forming units (PFU) per ml over time. Each data point represents averaged data from supernatant collected from 10 different wells (5 wells harvested for RNA and 5 wells fractionated for proteins and lipids). The graphs in panels A, B, and C show levels of replication detected for all three tissue donors in all three cell types. Error bars indicate standard deviations from the means. (D) Functional enrichment was performed on transcriptomic data from all three donor samples in both cell types, and results were only retained that were present in all three donors, keeping only the least significant score. In this way, a true consensus response is represented by all indicated functions. (E) Functional enrichment was performed on proteomic data from all three donor samples in both cell types, and results were only retained that were present in all three donors, as in panel D. The blue arrow highlights proteins in the hemoglobin complex, and red asterisks highlight apoptotic proteins from the endoplasmic reticulum.
FIG 2
FIG 2
Lipidomics and cell viability assessment support activation of apoptotic pathways in MERS-CoV-infected microvascular endothelial cells but not fibroblasts. (A) Enrichment analysis using lipid classes as enrichment sets. TG, triglycerides; Cer, ceramide; CL, cardiolipins; CE, cholesterol esters; PA, phosphatidic acid; GalCer, galactosylceramide; GM3, GM3 ganglioside; PI, phosphatidylinositol; DG, diglycerides; PS, phosphatidylserine; PG, phosphatidylglycerol; SM, sphingomyelin; PE, phosphatidylethanolamine; PC, phosphatidylcholine. (B) Abundance of individual lipid species, whose fold change compared to mock-infected samples was at a P value of 0.001 or below in at least one condition and was a member of one of the indicated lipid classes (triglycerides or ceramides). (C and D) Cell viability following MERS-CoV infection. Donor-matched MVE and FB were infected with wild-type MERS-CoV and assessed for cell viability using the CellTiter-Glo kit according to the manufacturer’s instructions (Promega) at the indicated times postinfection. Relative light units were graphed over time, and error bars indicate standard deviations from the means. Statistical analysis was performed in GraphPad and determined by Mann-Whitney U test. Gray bars, mock-infected cells; red bars, MERS-CoV-infected MVE; blue bars, MERS-CoV-infected FB; ****, P < 0.0001; **, P < 0.002; ns, not statistically significant.
FIG 3
FIG 3
Caspases 3/7 are activated following MERS-CoV infection of primary human lung MVE but not primary lung FB. (A to D) Donor-matched MVE and FB were plated and mock infected or infected with UV-inactivated or wild-type MERS-CoV (MOI of 5), and, at 24 and 48 h postinfection, caspase 3/7 activation or cell viability was determined according to the manufacturer’s instructions using the Apotox Triplex kit (each well was measured for both parameters). Uninfected cells were treated with staurosporine (8 μM MVE/10 μM FB) to determine the maximal amount of caspase 3/7 activation. Uninfected cells were treated with ionomycin (50 μM MVE/60 μM FB) to demonstrate loss of cell viability via a nonapoptotic pathway. Results are graphed as relative light units, and error bars indicate standard deviations from the means. Statistical analysis was performed in GraphPad and determined by Mann-Whitney U test. (A and B) Results from caspase 3/7 activation. (C and D) Results from cell viability assay. Solid red bars, MVE 24-h samples; open red bars, MVE 48-h samples; solid blue bars, FB 24-h samples; open blue bars, FB 48-h samples. ****, P < 0.0001; ***, P < 0.002; ns, not statistically significant.
FIG 4
FIG 4
Protein markers suggest activation of unfolded protein response (UPR) in MVE. (A to C) Protein expression of markers of the unfolded protein response. Each figure shows the expression behavior of a UPR marker in FB (blue) and MVE (red), with individual donors represented separately as individual color hues. For each donor, a time course of expression is shown that includes samples taken at 0, 12, 24, 36, and 48 h postinfection. Values are expressed as the log10 P value of the change between the infection and control conditions, with sign assigned according to the direction of fold change. (D to F) Viral protein expression. MERS-CoV spike, open reading frame 4a (ORF4a), and membrane protein abundances are represented as the ratio of each protein to the average abundance of all other proteins detected in each sample. GRP78, glucose-regulated protein 78; BiP, binding immunoglobulin protein; GRP94, glucose-regulated protein 94; HSP90B1, heat shock protein 90-kDa beta member 1; CANX, calnexin.
FIG 5
FIG 5
Increased caspase 3/7 activation following treatment with trans-ISRIB and MERS-CoV infection of MVE and FB support the activation of the integrated stress response. (A and B) Donor-matched uninfected FB (circles, A) and MVE (circles, B) were treated with serial dilutions of trans-ISRIB inhibitor (2.5 μM to 0.00488 μM) and cell viability assessed at 48 h posttreatment using Promega’s CellTiter Glo kit according to the manufacturer’s instructions. Each circle represents mean values from two experiments graphed as percent toxicity. Error bars indicate standard deviations from the means. In parallel, the same donor-matched FB (squares, A) and MVE (squares, B) were infected with MERS-nanoluc and simultaneously treated with the same serial dilutions of trans-ISRIB. Nanoluciferase expression was assayed at 48 h postinfection (squares, A and B) using Promega’s NanoGlo kit according to the manufacturer’s instructions. Control wells were either treated with drug diluent and UV-inactivated virus or infected with MERS-nanoluc (MOI, 5) and treated with only drug diluent. Each square represents mean values from two experiments graphed as percent inhibition. Error bars indicate standard deviations from the means. Blue squares, MERS-nanoluc-infected FB treated with trans-ISRIB serial dilutions; blue circles, uninfected FB treated with trans-ISRIB serial dilutions; red squares, MERS-nanoluc-infected MVE treated with trans-ISRIB serial dilutions; red circles, uninfected MVE treated with trans-ISRIB serial dilutions; MVE, primary human lung microvascular endothelial cell; FB, primary human lung fibroblast; MERS-nanoluc, MERS-CoV expressing nanoluciferase. (C and D) Donor-matched FB (C) and MVE (D) were plated and infected with UV-inactivated or wild-type MERS-CoV, and at 48 h postinfection caspase 3/7 activation was determined according to the manufacturer’s instructions using the Apotox Triplex kit. Control uninfected cells were treated with staurosporine (8 μM MVE/10 μM FB, activates caspase 3/7) or ionomycin (50 μM MVE/60 μM FB, does not activate caspase 3/7). Results are graphed as relative light units, and error bars indicate standard deviations from the means. Statistical analysis was performed in GraphPad and determined by Mann-Whitney U test. Blue bars, MERS-CoV-infected FB treated with the indicated compound; red bars, MERS-CoV-infected MVE treated with the indicated compound. *, P < 0.03; **, P < 0.004; ns, not statistically significant.
FIG 6
FIG 6
PERK inhibitor AMG PERK 44 reduces MERS-CoV replication in infected primary human lung MVE and FB. (A to D) Donor-matched uninfected FB (circles, A and B) and MVE (circles, C and D) were treated with serial dilutions of PERK inhibitor (100 μM to 2 μM), and cell viability was assessed at 24 (A and C) and 48 (B and D) h posttreatment using Promega’s CellTiter Glo kit according to the manufacturer’s instructions. Each circle represents mean values from two experiments graphed as percent toxicity. Error bars indicate standard deviations from the means. In parallel, the same donor-matched FB (squares, A and B) and MVE (squares, C and D) were infected with MERS-nanoluc and simultaneously treated with the same serial dilutions of PERK inhibitor. Nanoluciferase expression was assayed at 24 (squares, A and C) and 48 (squares, B and D) h postinfection using Promega’s NanoGlo kit according to the manufacturer’s instructions. Control wells were either treated with drug diluent and UV-inactivated virus or infected with MERS-nanoluc (MOI, 5) and treated with only drug diluent. Each square represents mean values from two experiments and are graphed as percent inhibition. Error bars indicate standard deviations from the means. Blue squares, MERS-nanoluc-infected FB treated with PERK inhibitor serial dilutions; blue circles, uninfected FB treated with PERK inhibitor serial dilutions; red squares, MERS-nanoluc infected MVE treated with PERK inhibitor serial dilutions; red circles, uninfected MVE treated with PERK inhibitor serial dilutions. PERK, protein kinase R-like ER kinase; MVE, primary human lung microvascular endothelial cell; FB, primary human lung fibroblast; MERS-nanoluc, MERS-CoV expressing nanoluciferase.
FIG 7
FIG 7
PERK inhibitor AMG PERK 44 treatment decreases MERS-CoV pathogenesis. (A to G) hDPP4 mice were treated with PERK inhibitor AMG PERK 44 or sham control and infected with 5 × 104 PFU of MERS-CoV MAm35c4 or PBS control. (A and B) Weight loss was observed over the course of a 7-day infection. (C to F) Daily respiratory function measurements were taken via whole-body plethysmography. (G) Viral titers were scored at the time of harvest. Error bars indicate standard errors of the means. *, P  < 0.05.
FIG 8
FIG 8
AMG PERK 44 reduces clinical signs of acute lung injury in MERS-CoV challenge model. (A to E) The histological features of acute lung injury were blindly scored using the American Thoracic Society Lung Injury Scoring system by Matute-Bello, creating an aggregate score for neutrophils in the alveolar and interstitial space, hyaline membranes, proteinaceous debris filling the air spaces, and alveolar septal thickening. (A and B) Scoring for ALI and diffuse alveolar damage in male and female mice, respectively. (C to E) Representative lung pathology for mock-infected (C), MERS-CoV-infected and sham-treated (D), and MERS-CoV-infected and AMG PERK 44-treated (E) male mice at 7 days postinfection. (F) Pulmonary discoloration was scored at the time of harvest. *, P < 0.001.

References

    1. Graham RL, Donaldson EF, Baric RS. 2013. A decade after SARS: strategies for controlling emerging coronaviruses. Nat Rev Microbiol 11:836–848. doi:10.1038/nrmicro3143. - DOI - PMC - PubMed
    1. Peiris JS, Guan Y, Yuen KY. 2004. Severe acute respiratory syndrome. Nat Med 10:S88–S97. doi:10.1038/nm1143. - DOI - PMC - PubMed
    1. Zaki AM, van Boheemen S, Bestebroer TM, Osterhaus AD, Fouchier RA. 2012. Isolation of a novel coronavirus from a man with pneumonia in Saudi Arabia. N Engl J Med 367:1814–1820. doi:10.1056/NEJMoa1211721. - DOI - PubMed
    1. Ng DL, Al Hosani F, Keating MK, Gerber SI, Jones TL, Metcalfe MG, Tong S, Tao Y, Alami NN, Haynes LM, Mutei MA, Abdel-Wareth L, Uyeki TM, Swerdlow DL, Barakat M, Zaki SR. 2016. Clinicopathologic, immunohistochemical, and ultrastructural findings of a fatal case of Middle East respiratory syndrome coronavirus infection in the United Arab Emirates, April 2014. Am J Pathol 186:652–658. doi:10.1016/j.ajpath.2015.10.024. - DOI - PMC - PubMed
    1. Blondonnet R, Constantin JM, Sapin V, Jabaudon M. 2016. A pathophysiologic approach to biomarkers in acute respiratory distress syndrome. Dis Markers 2016:3501373. doi:10.1155/2016/3501373. - DOI - PMC - PubMed

Publication types

LinkOut - more resources