. 2021 Aug 9;18(1):18.
doi: 10.1186/s12014-021-09324-y.

Proteome profiling of human placenta reveals developmental stage-dependent alterations in protein signature

Affiliations

Proteome profiling of human placenta reveals developmental stage-dependent alterations in protein signature

Sara Khorami Sarvestani et al. Clin Proteomics. .

Abstract

Introduction: Placenta is a complex organ that plays a significant role in the maintenance of pregnancy health. It is a dynamic organ that undergoes dramatic changes in growth and development at different stages of gestation. In the first-trimester, the conceptus develops in a low oxygen environment that favors organogenesis in the embryo and cell proliferation and angiogenesis in the placenta; later in pregnancy, higher oxygen concentration is required to support the rapid growth of the fetus. This oxygen transition, which appears unique to the human placenta, must be finely tuned through successive rounds of protein signature alterations. This study compares placental proteome in normal first-trimester (FT) and term human placentas (TP).

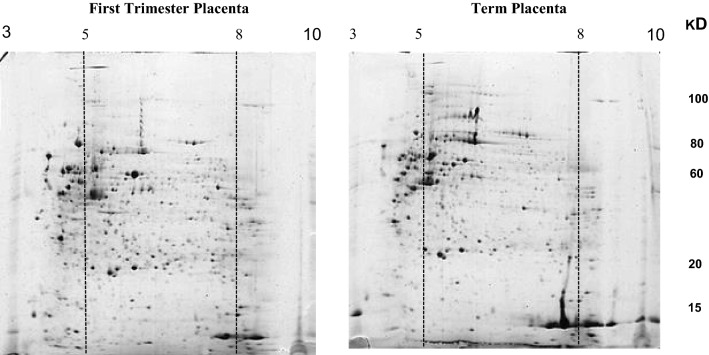
Methods: Normal human first-trimester and term placental samples were collected and differentially expressed proteins were identified using two-dimensional liquid chromatography-tandem mass spectrometry.

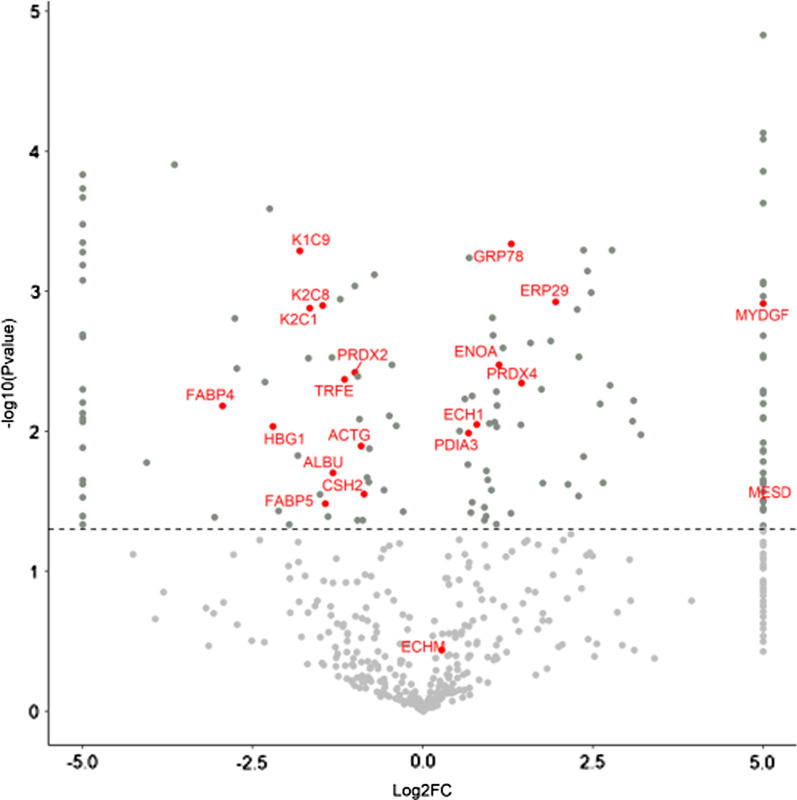
Results: Despite the overall similarities, 120 proteins were differently expressed in first and term placentas. Out of these, 72 were up-regulated and 48 were down-regulated in the first when compared with the full term placentas. Twenty out of 120 differently expressed proteins were sequenced, among them seven showed increased (GRP78, PDIA3, ENOA, ECH1, PRDX4, ERP29, ECHM), eleven decreased (TRFE, ALBU, K2C1, ACTG, CSH2, PRDX2, FABP5, HBG1, FABP4, K2C8, K1C9) expression in first-trimester compared to the full-term placentas and two proteins exclusively expressed in first-trimester placentas (MESD, MYDGF).

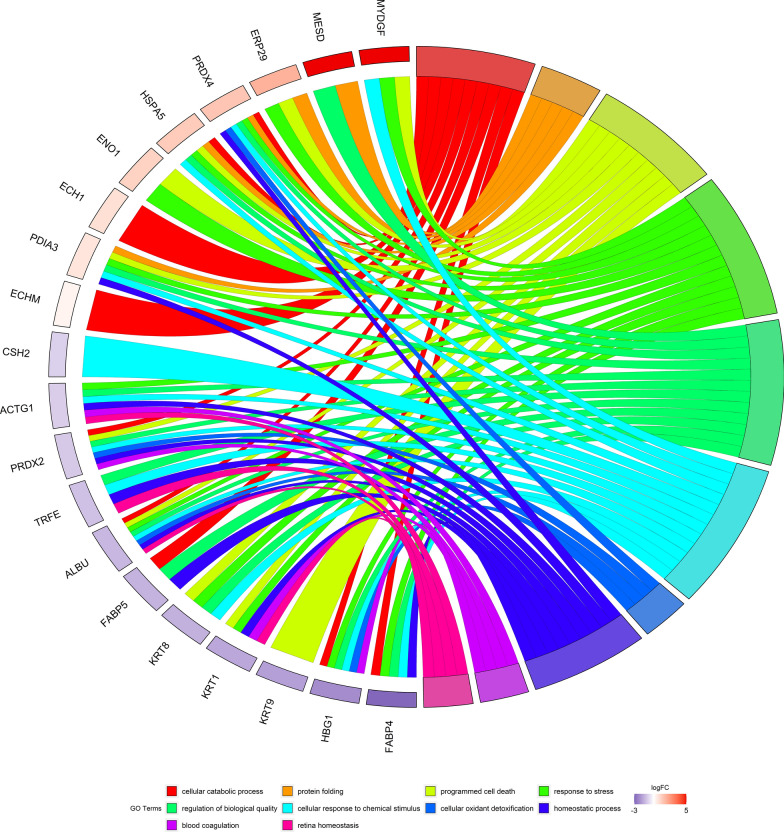
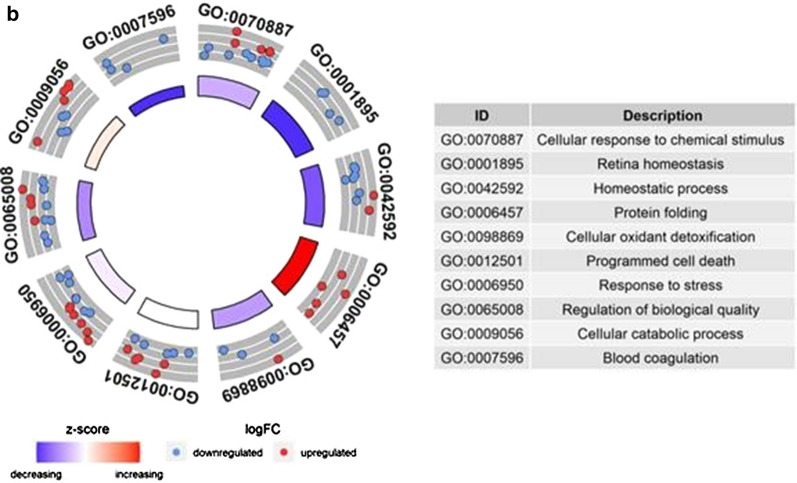
Conclusion: According to Reactome and PANTHER softwares, these proteins were mostly involved in response to chemical stimulus and stress, regulation of biological quality, programmed cell death, hemostatic and catabolic processes, protein folding, cellular oxidant detoxification, coagulation and retina homeostasis. Elucidation of alteration in protein signature during placental development would provide researchers with a better understanding of the critical biological processes of placentogenesis and delineate proteins involved in regulation of placental function during development.

Keywords: 2D LC–MS/MS; First-trimester; Full-term; Placenta; Proteomics.


Conflict of interest statement

The authors declare that they have no competing interests.

Figures

Fig. 1
Fig. 1
2D gel electrophoresis of human placenta. Protein lysate from normal human FT and TP was separated in first dimension on IPG strip (17 cm, pI range 3–10) and in the second dimension by SDS-PAGE (8–15%gradient gel). Gels were stained with colloidal Coomassie stain. Differential protein spots were mostly localized in pI range of 5–8. FT: First trimester placenta; TP: Term placenta
Fig. 2
Fig. 2
2D gel electrophoresis of differentially expressed proteins in FT and TP. Proteins were separated in first dimension on IPG strip (17 cm, pI range 5–8) and in the second dimension by SDS-PAGE (8–15%gradient gel). Gels were stained with colloidal Coomassie stain and differentially expressed proteins (DEP) were identified using image master 2D platinum software. Twenty DEP (arrowhead) were selected and subjected to mass spectrometry (LC–MS/MS). The picture depicts representative image of four independent experiments. FT: First trimester placenta; TP: Term placenta
Fig. 3
Fig. 3
Volcano plot of quantitative placenta proteomic analysis of FT and TP. 513 matched protein dots in first and third- trimester placentas are shown in a Volcano plot. Statistical analysis was performed by student t-test, and statistical significance was considered when p < 0.05. Red dots represent identified proteins exhibiting significant fold changes (FC) in the normal FT compared to TP. Despite no significant fold change for ECHM, this spot was carefully selected in visual inspection of the stained gels. MYDGF and MESD were only expressed in first-trimester placentas and located at infinitive region of the plot. FT: First trimester placenta; TP: Term placenta
Fig. 4
Fig. 4
Biological procecesses of differentially expressed proteins in FT and TP: A GOChord plot of top 10 ranked overrepresented GO terms belonging to the biological process in 20 detected placenta proteins. The placenta proteins are linked to their assigned terms via colored ribbons. Placenta proteins were ordered according to the observed log-fold change of first trimester placenta compared to term one (logFC), which is displayed in descending intensity of red squares displayed next to the selected genes. Circle drawing represented detected proteins in the mainly involved biological processes. B The circle plot of the differently expressed proteins and z-scores of GO BP (bilogical process) terms. The outer circle shows a scatter plot of the assigned proteins. Red circles display up-regulation and blue ones down-regulation. The inner circle shows the z-score of each GO BP term. The width of each bar corresponds to the number of proteins within GO BP term and the color corresponds to the z-score
Fig. 4
Fig. 4
Biological procecesses of differentially expressed proteins in FT and TP: A GOChord plot of top 10 ranked overrepresented GO terms belonging to the biological process in 20 detected placenta proteins. The placenta proteins are linked to their assigned terms via colored ribbons. Placenta proteins were ordered according to the observed log-fold change of first trimester placenta compared to term one (logFC), which is displayed in descending intensity of red squares displayed next to the selected genes. Circle drawing represented detected proteins in the mainly involved biological processes. B The circle plot of the differently expressed proteins and z-scores of GO BP (bilogical process) terms. The outer circle shows a scatter plot of the assigned proteins. Red circles display up-regulation and blue ones down-regulation. The inner circle shows the z-score of each GO BP term. The width of each bar corresponds to the number of proteins within GO BP term and the color corresponds to the z-score

References

    1. Dizon-Townson DS, Lu J, Morgan TK, Ward KJ. Genetic expression by fetal chorionic villi during the first trimester of human gestation. Am J Obstet Gynecol. 2000;183(3):706–711. doi: 10.1067/mob.2000.106583. - DOI - PubMed
    1. Morrish DW, Dakour J, Li H. Functional regulation of human trophoblast differentiation. J Reprod Immunol. 1998;39(1–2):179–195. doi: 10.1016/S0165-0378(98)00021-7. - DOI - PubMed
    1. Sitras V, Fenton C, Paulssen R, Vårtun Å, Acharya G. Differences in gene expression between first and third trimester human placenta: a microarray study. PloS ONE. 2012;7(3):e33294. doi: 10.1371/journal.pone.0033294. - DOI - PMC - PubMed
    1. Mikheev AM, Nabekura T, Kaddoumi A, Bammler TK, Govindarajan R, Hebert MF, et al. Profiling gene expression in human placentae of different gestational ages: an OPRU Network and UW SCOR Study. Reprod Sci. 2008;15(9):866–877. doi: 10.1177/1933719108322425. - DOI - PMC - PubMed
    1. Red-Horse K, Zhou Y, Genbacev O, Prakobphol A, Foulk R, McMaster M, et al. Trophoblast differentiation during embryo implantation and formation of the maternal-fetal interface. J Clin Investig. 2004;114(6):744–754. doi: 10.1172/JCI200422991. - DOI - PMC - PubMed