. 2021 Aug 10;7(1):64.
doi: 10.1038/s41421-021-00300-2.

Integrated single-cell analysis revealed immune dynamics during Ad5-nCoV immunization

Affiliations

Integrated single-cell analysis revealed immune dynamics during Ad5-nCoV immunization

Qiqi Cao et al. Cell Discov. .

Abstract

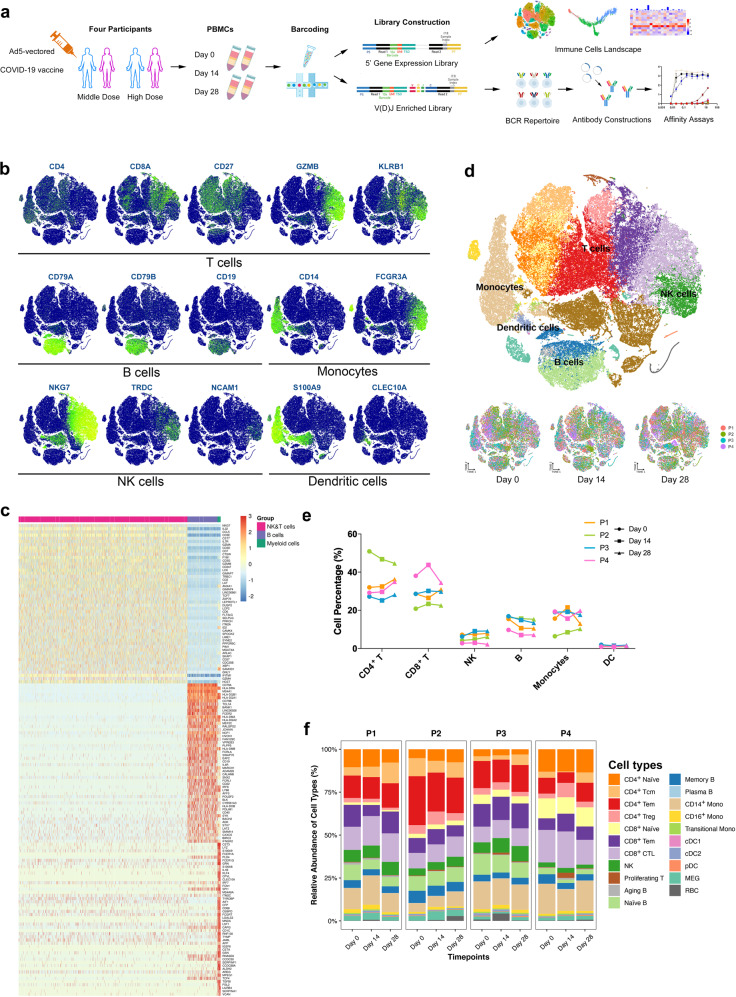
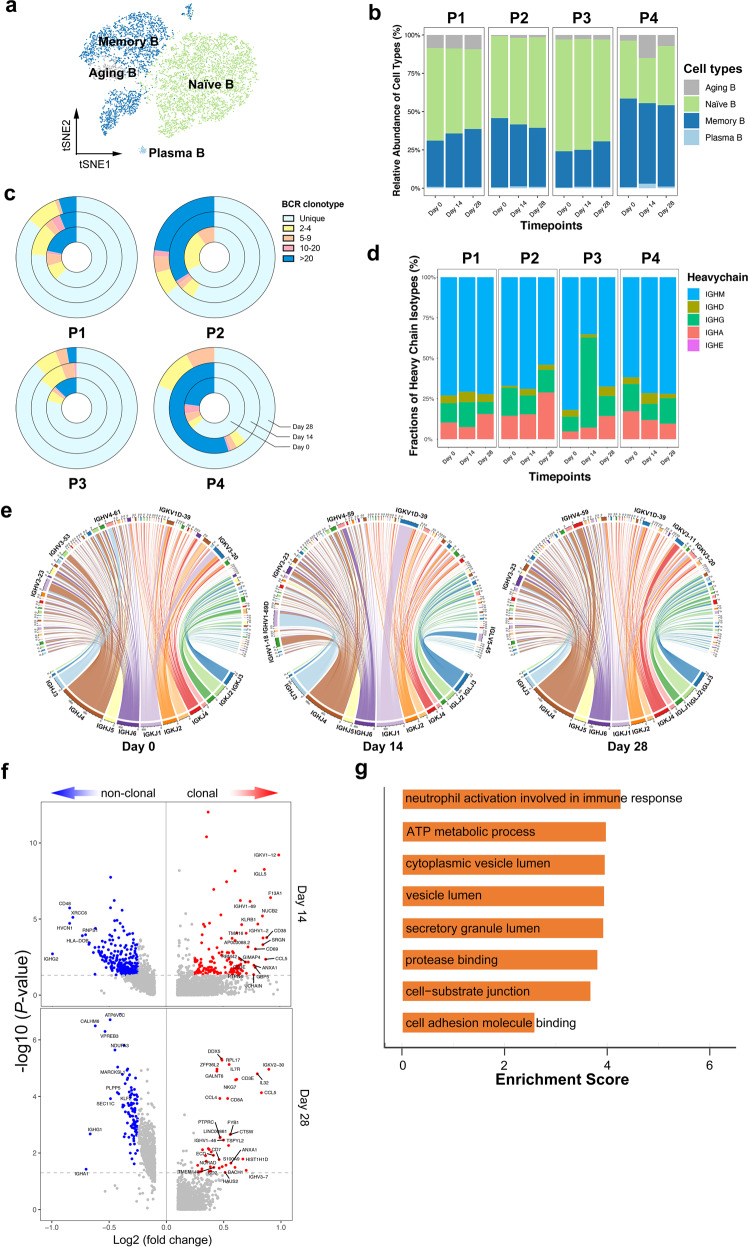
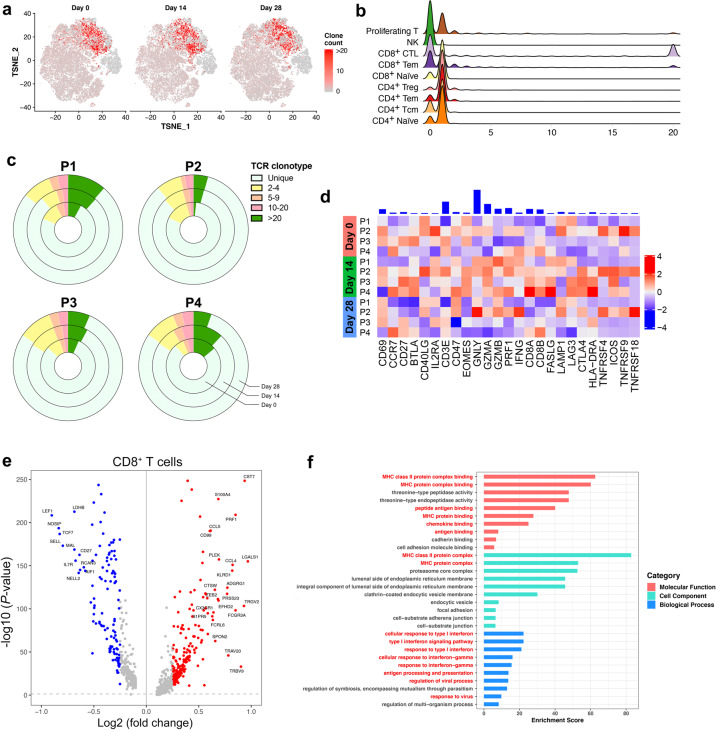
Coronavirus disease 2019 (COVID-19), driven by SARS-CoV-2, is a severe infectious disease that has become a global health threat. Vaccines are among the most effective public health tools for combating COVID-19. Immune status is critical for evaluating the safety and response to the vaccine, however, the evolution of the immune response during immunization remains poorly understood. Single-cell RNA sequencing (scRNA-seq) represents a powerful tool for dissecting multicellular behavior and discovering therapeutic antibodies. Herein, by performing scRNA/V(D)J-seq on peripheral blood mononuclear cells from four COVID-19 vaccine trial participants longitudinally during immunization, we revealed enhanced cellular immunity with concerted and cell type-specific IFN responses as well as boosted humoral immunity with SARS-CoV-2-specific antibodies. Based on the CDR3 sequence and germline enrichment, we were able to identify several potential binding antibodies. We synthesized, expressed and tested 21 clones from the identified lineages. Among them, one monoclonal antibody (P3V6-1) exhibited relatively high affinity with the extracellular domain of Spike protein, which might be a promising therapeutic reagent for COVID-19. Overall, our findings provide insights for assessing vaccine through the novel scRNA/V(D)J-seq approach, which might facilitate the development of more potent, durable and safe prophylactic vaccines.


Conflict of interest statement

The authors declare no competing interests.

Figures

Fig. 1
Fig. 1. Dissection of immune dynamics during immunization with scRNA-seq.
a Workflow of PBMCs collection, processing, sequencing, data analysis, and antibody validation. Cells from four participants at three timepoints were subjected to scRNA-seq and scV(D)J-seq. Antigen-specific antibodies were predicted and screened based on the CDR3 sequence from scBCR-seq. PBMCs, peripheral blood mononuclear cells. b t-SNE projection of canonical markers of each cell type. Cells are annotated based on differential expression analysis on orthogonally discovered clusters. c Heatmap revealing the scaled expression of DEGs for B cells, NK and T cells, and myeloid cells. d ScRNA-seq visualization with t-SNE analysis of PBMCs (n = 92,456) from all participants and timepoints sampled (top), and t-SNE annotated by timepoints and colored by individuals (bottom). e Proportions of major cell types from each participant at different timepoints assayed in this study. f Proportions of different cell types in the total PBMCs from participants at different timepoints by scRNA-seq.
Fig. 2
Fig. 2. Humoral immune response and expanded BCR cloning during immunization.
at-SNE analysis of B cells subtypes from all participants and timepoints. b Proportions of the B cell subtypes across participants and timepoints. c The pie plot showing the BCR clone differences across timepoints. The complexity and distribution of clonotypes differed among samples. d The bar plot showing the relative percentage of each isotype by each participant and timepoint. e The circus plots of the rearrangements of the BCR chains split by timepoints. The arc length of each segment corresponds to the relative frequency of each VDJ gene family. Within each plot, pairing VDJ gene segments are represented by colored ribbons. Ribbon width corresponds to frequency of the represented pairing. f The volcano plot showing the DEGs of expanded vs. non-expanded memory B cells and plasma cells at day 14 and day 28 post-vaccination. Genes with greatest fold changes and significant P values were annotated in the plot. g The enriched GO terms of the DEGs in expanded B cells upregulated 28 days post-vaccination.
Fig. 3
Fig. 3. Antibody design and validation based on germline and CDR3 analysis.
a Workflow of antibody identification and functional analysis. Potential antibody sequences were predicted according to screening strategies described in “Materials and methods”. The antibodies were then constructed and expressed for further functional analysis. b Binding curves of five representative mAbs to S-RBD. S309 is a positive control while hIgFC is a negative control. c Binding curves of five representative mAbs to S-ECD. 4A8 is a positive control that was reported to bind the S-ECD of SARS-CoV-2. d Diagram showing the binding of mAbs (EC50 value) to S-ECD determined by ELISA. EC50 values greater than 100 μg/mL are indicated as ">". e Pseudotyped virus neutralization assay to test the neutralization potency with gradient diluted P3V6-1. Infected cells were identified as GFP-positive cells. Images were obtained by using fluorescence microscopy. Scale bars, 40 µm.
Fig. 4
Fig. 4. Cellular immune response peaked at day 14 post-vaccination.
at-SNE analysis of NK and T cell subtypes from all participants and timepoints. b Proportions of the NK and T cell subtypes in the total NK and T cells from participants at different timepoints by scRNA-seq. c Proportions of NK and T cell subtypes of each sample in the total NK and T cells. d Heatmap of z-scored mean expression of IFN-response signature (defined as the normalized mean expression of genes in the activation signature in Supplementary Table S3) across T cells from each participant and timepoint. Top, bar plot of total expression of each gene, across all patients. e Mean expression of four common ISGs (EIF2AK2, IFIH1, ISG15, and TRIM25) in CD4+ T, CD8+ T, monocytes and NK cells, which are indicated by timepoints and individuals. Shaded area denotes 95% CI of the mean value. f Dot plot of the interactions (predicted by ligand/receptor interaction database cellPhoneDB) between monocytes and other immune cell types in the middle- and high-dose group. P values are indicated by the circle sizes, as shown in the scale on the bottom. The means of the average expression level of interacting molecule 1 in cluster 1 and interacting molecule 2 in cluster 2 are indicated by the color.
Fig. 5
Fig. 5. Dissection of T cells and TCR repertoire.
at-SNE showing expanded TCR clones (n ≥ 2) in the total T cells indicated by timepoints. b Counts of expanded TCR clones in T cell subtypes. c The pie plot showing the TCR clone differences across the different timepoints and individuals. d Heatmap of z-scored mean expression of T cell activation signature (defined as the normalized mean expression of genes in the activation signature in Supplementary Table S4) across T cells from each participants and timepoints. Top, bar plot of total expression of each gene, across all patients. Expression of T cell activation signature shows variability among individuals. e The volcano plot showing the DEGs between CD8+ T cells with expanded and unexpanded TCR clones at day 14 post-vaccination. Genes with greatest fold changes and significant P values were annotated in the plot. f The enriched GO terms of the DEGs between T cells with expanded and unexpanded TCR clones at day 14 post-vaccination. P value was derived by a hypergeometric test.
Fig. 6
Fig. 6. Trajectory analysis revealed the overtime shifting of T cell phenotypes.
a Pseudotime trajectories for CD8+ T cells based on Monocle2, color-coded for the CD8+ T cell phenotypes. b Pseudotime trajectories for CD8+ T cells, color-coded for the pseudotime. c Gene expression dynamics along the CD8+ T cells lineage. Genes were clustered into 6 gene sets, and each of them was characterized by specific expression profiles. d Genes involved in the function and response of T cells modeled along the CD8+ T cell lineages at different timepoints. See also “Materials and methods” for constructing single-cell trajectories.

Similar articles

Cited by

References

    1. COVID-19 Dashboard by the Center for Systems Science and Engineering (CSSE) at Johns Hopkins University (JHU), https://coronavirus.jhu.edu/map.html (2021).
    1. Baum A, et al. Antibody cocktail to SARS-CoV-2 spike protein prevents rapid mutational escape seen with individual antibodies. Science. 2020;369:1014–1018. doi: 10.1126/science.abd0831. - DOI - PMC - PubMed
    1. Rogers TF, et al. Isolation of potent SARS-CoV-2 neutralizing antibodies and protection from disease in a small animal model. Science. 2020;369:956–963. doi: 10.1126/science.abc7520. - DOI - PMC - PubMed
    1. Brouwer PJM, et al. Potent neutralizing antibodies from COVID-19 patients define multiple targets of vulnerability. Science. 2020;369:643–650. doi: 10.1126/science.abc5902. - DOI - PMC - PubMed
    1. Shi R, et al. A human neutralizing antibody targets the receptor-binding site of SARS-CoV-2. Nature. 2020;584:120–124. doi: 10.1038/s41586-020-2381-y. - DOI - PubMed