. 2021 Aug 9;11(1):16077.
doi: 10.1038/s41598-021-95381-0.

CREB signaling activity correlates with differentiation and survival in medulloblastoma

Affiliations

CREB signaling activity correlates with differentiation and survival in medulloblastoma

Inna Armandari et al. Sci Rep. .

Abstract

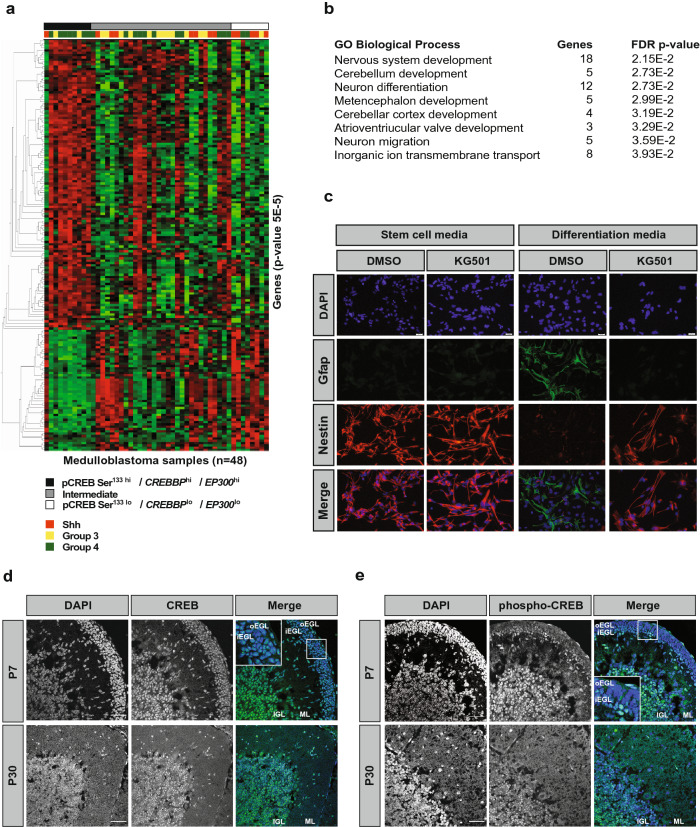
While there has been significant progress in the molecular characterization of the childhood brain cancer medulloblastoma, the tumor proteome remains less explored. However, it is important to obtain a complete understanding of medulloblastoma protein biology, since interactions between proteins represent potential new drug targets. Using previously generated phosphoprotein signaling-profiles of a large cohort of primary medulloblastoma, we discovered that phosphorylation of transcription factor CREB strongly correlates with medulloblastoma survival and associates with a differentiation phenotype. We further found that during normal cerebellar development, phosphorylated CREB was selectively expressed in differentiating cerebellar granule neuron progenitor (CGNP) cells. In line, we observed increased differentiation in CGNPs treated with Forskolin, Bmp6 and Bmp12 (Gdf7), which induce CREB phosphorylation. Lastly, we demonstrated that inducing CREB activation via PKA-mediated CREB signaling, but not Bmp/MEK/ERK mediated signalling, enhances medulloblastoma cell sensitivity to chemotherapy.


Conflict of interest statement

The authors declare no competing interests.

Figures

Figure 1
Figure 1
CREB phosphorylation status correlates with medulloblastoma survival. (a,b) Kaplan–Meier overall survival curves of medulloblastoma patients grouped by below average (dashed blue line) and above average (solid red line) based on (a) pCREB Ser133 peptide phosphorylation level; and (b) CREB1 mRNA expression level. (c–e) Kaplan–Meier overall survival curves of (c) SHH (n = 13), (d) Group 3 (n = 15), or (e) Group 4 (n = 17) medulloblastoma patients grouped by below average (dash blue line) and above average (solid red line) pCREB Ser133 peptide phosphorylation level. P-values were determined using a log-rank (Mantel-Cox) test, and p < 0.05 was considered significant. For patient and clustering data, see Supplementary Table S1.
Figure 2
Figure 2
The CREB transcriptional complex is associated with medulloblastoma survival. (a,b) Kaplan–Meier overall survival curves of medulloblastoma patients (n = 49) grouped by below average (dashed blue line) and above average (solid red line) based on (a) CREBBP mRNA expression level, and (b) EP300 mRNA expression level. (c,d) Kaplan–Meier overall survival curves of medulloblastoma patients (n = 49) grouped by average (c) pCREB Ser133 peptide phosphorylation level and CREBBP mRNA expression level, or (d) pCREB Ser133 peptide phosphorylation level and EP300 mRNA expression level. Groups consisted of samples exhibiting above average pCREB Ser133 (pCREB Ser133 hi) and either above average CREBBP, or EP300 mRNA expression (CREBBPhi or EP300hi) (solid red lines, n = 16 and n = 11, respectively); samples exhibiting below average pCREB Ser133 (pCREB Ser133 lo) and either below average CREBBP, or EP300 mRNA expression (CREBBPlo or EP300lo) (dashed blue lines, n = 10 and n = 10, respectively); and samples with other combinations (Intermediate) (dashed black lines, n = 19 and n = 24). P-values were determined using a log-rank (Mantel-Cox) test, and p < 0.05 was considered significant. For patient and clustering data, see Supplementary Table S1. (e) Western blots showing protein expression of CREB, CREBBP, or p300 in MED8A cells with CREB1 knockdown (shCREB1.1 and shCREB1.2), CREBBP knockdown (shCREBBP.1 and shCREBBP.2), or EP300 knockdown (shEP300) compared to control (shSCR). Histone H3 was used as loading control. All images are cropped and derived from the same blot (cut for different probes). For full images, see Supplementary file. (f) WST-1 cell viability assays showing the cell viability of MED8A cells after CREB1 knockdown, CREBBP knockdown, or EP300 knockdown compared to control (shSCR) upon treatment with Etoposide (concentration range, 0–10 μM) (n = 3, unpaired t-test). AUC area under the curve. ***p < 0.001.
Figure 3
Figure 3
CREB-complex activity is associated with neural differentiation in tumors and developing cerebellum. (a) Heatmap showing the supervised hierarchical clustering of quantile normalized gene expression levels of primary medulloblastoma samples (n = 48) grouped by peptide phosphorylation and mRNA levels: pCREB Ser133 lo, EP300lo and CREBBPlo (white); pCREB Ser133 hi, EP300hi and CREBBPhi (black); or other combinations (Intermediate) (grey). Red indicates relatively high gene expression and green relatively low gene expression. Colored squares indicate molecular subgroup (Shh, red; Group 3, yellow; Group 4, green). For patient and clustering data, see Supplementary Table S1. (b) List of biological processes related to genes upregulated in pCREB Ser133 hi, EP300hi and CREBBPhi medulloblastoma tissue samples. (c) Representative fluorescent microphotographs showing DAPI (blue), Gfap (green), and Nestin (red) expression in neural stem cells treated with low dose KG-501 (3 μM) or mock (left panels), or differentiated cells with or without KG-501 (3 μM) (right panels). Scale bars indicate 500 μm. (d,e) Confocal images showing (d) CREB or (e) phospho-CREB expression in postnatal day 7 (P7) mouse cerebellum and P30 cerebellum. Scale bars indicate 45 μm. Insets show magnified views of CREB and phospho-CREB expression in the EGL (external granular layer). oEGL outer external granular layer; iEGL inner external granular layer; ML molecular layer; IGL internal granular layer.
Figure 4
Figure 4
CREB phosphorylation is associated with cerebellar differentiation. (a) Schematic overview of selected CREB-activating pathways. FSK activates the cAMP/PKA pathway by binding to AC. Bmp6/12 likely activate the MEK/ERK pathway and possibly also PKA. BMPR bone morphogenetic protein receptor; FSK forskolin; AC adenylate cyclase; cAMP cyclic adenosine monophosphate; PKA protein kinase A; ERK extracellular signal-regulated kinase; P phosphorylated. (b) Confocal images showing Bmp6 and Bmp12 protein localization in postnatal day 7 (P7) mouse cerebellum. Scale bars indicate 45 μm. EGL external granular layer; ML molecular layer; IGL internal granular layer. (c) Quantification of phospho-CREB expression in CGNPs treated with FSK (5 μM), Bmp6 (250 ng/mL), Bmp12 (250 ng/mL), or control (n = 3, Dunnett post-hoc test of one-way ANOVA). (d) Representative fluorescent microphotographs showing DAPI (blue) and Doublecortin (Dcx) (green) expression in CGNPs treated with FSK, Bmp6/Bmp12, or control. Arrows indicating longer neurites. Scale bars indicate 500 μm. (e) Quantitative RT-PCR for neuronal genes Doublecortin (Dcx), and glutamate receptor subunits Grin1, Grin2a, and Grin2b in P7 CGNPs treated with FSK, Bmp6/Bmp12, or control (n = 3, Dunnett post-hoc test of one-way ANOVA). All charts represent mean ± SEM. *p < 0.05, **p < 0.01, ****p < 0.0001.
Figure 5
Figure 5
CREB pathway activation enhances chemosensitivity. (a) Western blot and quantification by densitometry showing phospho-CREB and total CREB expression in serum starved RPE-1 cells following treatment with FSK (5 μM), Bmp6 (250 ng/mL), Bmp12 (250 ng/mL), or control (n = 4, unpaired t-test). Images are cropped and derived from the same blot (re-probed after stripping). GAPDH is used as a loading control. (b) Western blot showing phospho-CREB and total CREB expression in serum starved RPE-1 cells following treatment with FSK (5 μM), Bmp6 (250 ng/mL), Bmp12 (250 ng/mL), or control in the presence or absence of PKA pathway inhibitor H89 (20 μM). Images are cropped and derived from the same blot (re-probed after stripping). GAPDH is used as a loading control. (c) Western blot showing phospho-CREB, total CREB, phospho-ERK and total ERK expression in serum starved RPE-1 cells following treatment with FSK (5 μM), Bmp6 (250 ng/mL), Bmp12 (250 ng/mL), or control in the presence or absence of MEK/ERK pathway inhibitor PD98059 (25 μM). Images are cropped. CREB and phospho-CREB images derived from the same blot (re-probed after stripping). For phospho- and total ERK, samples were re-loaded onto another gel. Images are derived from the same blot. GAPDH is used as a loading control. (d) Chart showing RPE-1 cell viability upon treatment with Etoposide (3 μM), FSK (2 μM), Bmp6/12 (250 ng/mL) for 48 h (n = 3 experiments, unpaired t-test, Dunnett post-hoc test of one-way ANOVA). (e) Western blot showing phospho-CREB and total CREB expression in serum starved UW426 (left) and MED8A (right) cells following treatment with FSK (5 μM), Bmp6 (250 ng/mL), Bmp12 (250 ng/mL), or control. Images are cropped and derived from the same blot (re-probed after stripping). (f) Chart showing UW426 (left) and MED8A (right) cell viability upon treatment with Etoposide (3 and 0.5 μM, respectively), FSK (2 μM), Bmp6/12 (250 ng/mL) for 48 h (n = 3, unpaired t-test, Dunnett post-hoc test of one-way ANOVA). All charts represent mean ± SEM. *p < 0.05, **p < 0.01. For full images of the Western blots, see Supplementary file.

References

    1. Cavalli FMG, et al. Intertumoral heterogeneity within medulloblastoma subgroups. Cancer Cell. 2017;31:737–754.e6. doi: 10.1016/j.ccell.2017.05.005. - DOI - PMC - PubMed
    1. Hovestadt V, et al. Medulloblastomics revisited: Biological and clinical insights from thousands of patients. Nat. Rev. Cancer. 2020 doi: 10.1038/s41568-019-0223-8. - DOI - PMC - PubMed
    1. Staal JA, et al. Proteomic profiling of high risk medulloblastoma reveals functional biology. Oncotarget. 2015;6:14584–14595. doi: 10.18632/oncotarget.3927. - DOI - PMC - PubMed
    1. Zomerman WW, et al. Identification of two protein-signaling states delineating transcriptionally heterogeneous human medulloblastoma. Cell Rep. 2018 doi: 10.1016/j.celrep.2018.02.089. - DOI - PubMed
    1. Mayr B, Montminy M. Transcriptional regulation by the phosphorylation-dependent factor CREB. Nat. Rev. Mol. Cell Biol. 2001 doi: 10.1038/35085068. - DOI - PubMed

Publication types

MeSH terms

Substances