. 2021 Aug 9;11(1):16086.
doi: 10.1038/s41598-021-95451-3.

Isolation of HDL by sequential flotation ultracentrifugation followed by size exclusion chromatography reveals size-based enrichment of HDL-associated proteins

Affiliations

Isolation of HDL by sequential flotation ultracentrifugation followed by size exclusion chromatography reveals size-based enrichment of HDL-associated proteins

Jack Jingyuan Zheng et al. Sci Rep. .

Abstract

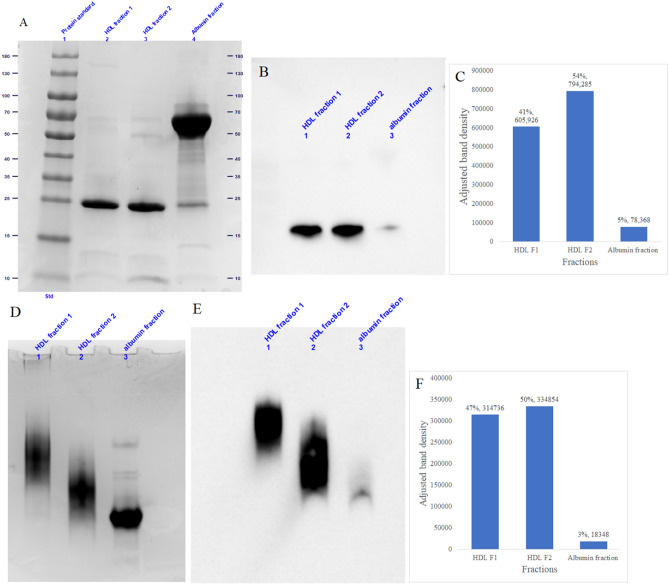
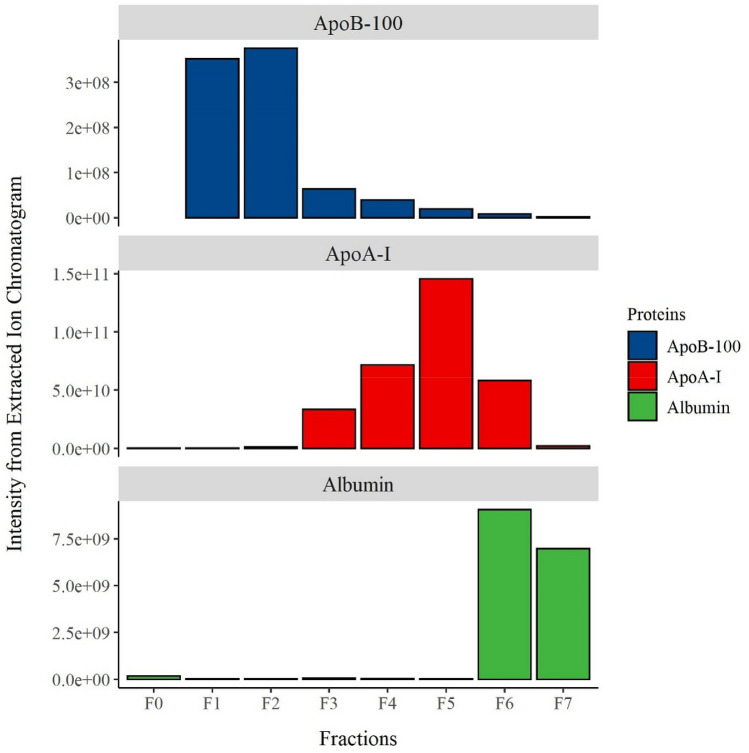
High-density lipoprotein (HDL) particles have multiple beneficial and cardioprotective roles, yet our understanding of their full structural and functional repertoire is limited due to challenges in separating HDL particles from contaminating plasma proteins and other lipid-carrying particles that overlap HDL in size and/or density. Here we describe a method for isolating HDL particles using a combination of sequential flotation density ultracentrifugation and fast protein liquid chromatography with a size exclusion column. Purity was visualized by polyacrylamide gel electrophoresis and verified by proteomics, while size and structural integrity were confirmed by transmission electron microscopy. This HDL isolation method can be used to isolate a high yield of purified HDL from a low starting plasma volume for functional analyses. This method also enables investigators to select their specific HDL fraction of interest: from the least inclusive but highest purity HDL fraction eluting in the middle of the HDL peak, to pooling all of the fractions to capture the breadth of HDL particles in the original plasma sample. We show that certain proteins such as lecithin cholesterol acyltransferase (LCAT), phospholipid transfer protein (PLTP), and clusterin (CLUS) are enriched in large HDL particles whereas proteins such as alpha-2HS-glycoprotein (A2HSG), alpha-1 antitrypsin (A1AT), and vitamin D binding protein (VDBP) are enriched or found exclusively in small HDL particles.


Conflict of interest statement

The authors declare no competing interests.

Figures

Figure 1
Figure 1
Schematic of the size and density range of lipoproteins and low-density plasma components. The white box indicates the density and size of high density lipoprotein (HDL) particles captured by this HDL isolation method, as well as the particle diameter (nm) and particle density (g/mL) of the other lipoprotein particles—chylomicrons, very low density lipoproteins (VLDL), intermediate density lipoproteins (IDL), low density lipoproteins (LDL), lipoprotein (a) (Lp(a)), and extracellular vesicles (EVs) present in plasma that are simultaneously isolated as part of this method.
Figure 2
Figure 2
Visual abstract of the isolation method. A starting plasma volume of 500uL is first subjected to sequential flotation ultracentrifugation (UC) at a density of d = 1.006 g/mL to float off the chylomicrons and very low density lipoproteins (VLDL) (A: particles with density d < 1.006 g/mL), followed by a second UC at a density of d = 1.21 g/mL to precipitate out the albumin and other plasma proteins (B: proteins with density d > 1.21 g/mL). The resulting supernatant of density in the range of 1.006–1.21 g/mL is then separated by size exclusion chromatography (SEC) to yield intermediate density lipoproteins (IDL)) (C: size range of 30–200 nm in diameter), low density lipoproteins (LDL) (D: size range of 18–30 nm in diameter), high density lipoproteins (HDL) (E: size range of 7–18 nm in diameter), and albumin (F: size < 7 nm in diameter).
Figure 3
Figure 3
Overall HDL total protein concentration of size exclusion chromatography (SEC) fractions with SEC chromatogram. (a) The total protein concentration of diluted HDL samples (500- and 1000-times) calculated from a fitted bovine serum albumin standard curve. The concentration for the 500- and 1000-times diluted HDL samples were calculated to be 8.57 ± 0.31 µg/mL and 4.08 ± 0.17 µg/mL, respectively. (b) SEC chromatogram of pooled plasma sample following sequential flotation ultracentrifugation, with fractionation set to collect 1-mL fractions starting at 6.5 mL. Fractions F1 and 2, correspond to the low density lipoprotein (LDL) particle size range; Fractions F3-6, correspond to the high density lipoprotein (HDL) particle size range, with fraction F6 containing a portion of the albumin peak; Fraction F7 corresponds to the albumin peak. (c) A chromatogram showing 8 repeated SEC on plasma aliquots from a plasma pool on several different days to demonstrate the technical reproducibility of the separation procedure. The mean ± standard deviation peak elution volume for the LDL peak, HDL peak, and albumin peak are 8.28 ± 0.007, 11.7 ± 0.027, and 13.6 ± 0.029 mL, respectively. The % coefficient of variation of these are 0.09%, 0.23%, and 0.21%, respectively.
Figure 4
Figure 4
Sodium dodecyl sulfate (SDS)- and native- polyacrylamide gel electrophoresis (PAGE) and Western blot analysis on HDL fraction 1, HDL fraction 2, and albumin fraction. (A) SDS-PAGE stained with coomassie blue protein stain. (B) Western blot membrane showing ApoA-I proteins transferred from the gel shown in (A). (C) The relative and absolute value of band density of each ApoA-I band in the Western blot shown in (B). (D) Native-PAGE stained with coomassie blue protein stain. (E) Western blot membrane showing ApoA-I proteins transferred from the gel shown in (D). (F) The relative and absolute value of band density of each ApoA-I band in the Western blot shown in (E).
Figure 5
Figure 5
Signal intensity from liquid chromatography-mass spectrometry (LC–MS). Intensity from Extracted Ion Chromatogram (XIC) for (A) Apolipoprotein B-100 (ApoB-100), (B) ApoA-I, and (C) albumin in SEC fractions F0-F7 corresponding to collected low density lipoprotein (LDL), high density lipoprotein (HDL), and albumin (Alb) fractions.
Figure 6
Figure 6
Signal intensity from Extracted Ion Chromatogram (XIC) for 12 selected HDL-associated proteins. (a) clusterin (CLUS), (b) apolipoprotein E (apoE), (c) phospholipid transfer protein (PLTP), (d) lecithin cholesterol acyl transferase (LCAT), (e) apolipoprotein C-III (apoC-III), (f) paraoxonase 1 (PON1), (g) apolipoprotein A-IV (ApoA-IV), (h) apolipoprotein A-II (ApoA-II), (i) serum amyloid A1 (SAA1), (j) α-2-HS-glycoprotein (A2HSG), (k) α-1-antitrypsin (A1AT), and (l) vitamin D binding protein (VDBP). The proteins are displayed such that those enriched in the early fractions corresponding to larger particles are shown in the left column, those distributed across all HDL fractions are shown in the middle column, and those enriched in the later fractions corresponding to smaller particles are shown in the right column. Proteomic analysis for fractions F0–F7 was performed, with fractions F1-F2 corresponding to the low density lipoprotein (LDL) peak, F3-F6 corresponding to the high density lipoprotein (HDL) peak, and fraction F7 corresponding to the albumin (Alb) peak.
Figure 7
Figure 7
Transmission electron microscopy micrographs of size exclusion chromatography (SEC) fractions. All fractions are displayed with a size bar of 20 nm. (a) Fraction F1 shows particles ranging in size from 18 to 28 nm. (b) Fraction F2 shows primarily particles in the size range of 18–28 nm, and some particles in the size range of 7–12 nm. (c) Fraction F3 shows particles in the size range of 7–18 nm, (d) Fraction F4 shows particles in the size range of 7–15 nm, (e) Fraction F5 shows particles in the size range of 7–12 nm, and (f) Fraction F6 shows particles in the size range of 7–10 nm. Fraction F7 is not displayed because no particles were visible in this fraction.
Figure 8
Figure 8
Comparison of the cholesterol efflux capacity of isolated HDL, ApoB-depleted plasma, and a positive control. HDL samples isolated by the current method has a comparable cholesterol efflux capacity (21.4 ± 1.3%) compared to that of ApoB-depleted plasma (22.1 ± 2.5%) or a positive control (23.1 ± 2.9%).

References

    1. Rosenson RS, et al. Dysfunctional HDL and atherosclerotic cardiovascular disease. Nat. Rev. Cardiol. 2016;13:48–60. doi: 10.1038/nrcardio.2015.124. - DOI - PMC - PubMed
    1. Miller GJ, Miller NE. Plasma-high-density-lipoprotein concentration and development of ischæmic heart-diseaSE. The Lancet. 1975;305:16–19. doi: 10.1016/S0140-6736(75)92376-4. - DOI - PubMed
    1. Vaisar T. Proteomics investigations of HDL: Challenges and promise. Curr. Vasc. Pharmacol. 2012;10:410–421. doi: 10.2174/157016112800812755. - DOI - PMC - PubMed
    1. Vickers KC, Palmisano BT, Shoucri BM, Shamburek RD, Remaley AT. MicroRNAs are transported in plasma and delivered to recipient cells by high-density lipoproteins. Nat. Cell Biol. 2011;13:423–433. doi: 10.1038/ncb2210. - DOI - PMC - PubMed
    1. Chapman MJ, Goldstein S, Lagrange D, Laplaud PM. A density gradient ultracentrifugal procedure for the isolation of the major lipoprotein classes from human serum. J. Lipid Res. 1981;22:339–358. doi: 10.1016/S0022-2275(20)35376-1. - DOI - PubMed

Publication types

MeSH terms