

Computational estimates of daily aggregate exposure to PFOA/PFOS from 2011 to 2017 using a basic intake model
- PMID: 34373583
- PMCID: PMC10568366
- DOI: 10.1038/s41370-021-00374-w
Computational estimates of daily aggregate exposure to PFOA/PFOS from 2011 to 2017 using a basic intake model
Abstract
Background: Human exposure to per- and polyfluoroalkyl substances has been modeled to estimate serum concentrations. Given that the production and use of these compounds have decreased in recent years, especially PFOA and PFOS, and that additional concentration data have become available from the US and other industrialized countries over the past decade, aggregate median intakes of these two compounds were estimated using more recent data.
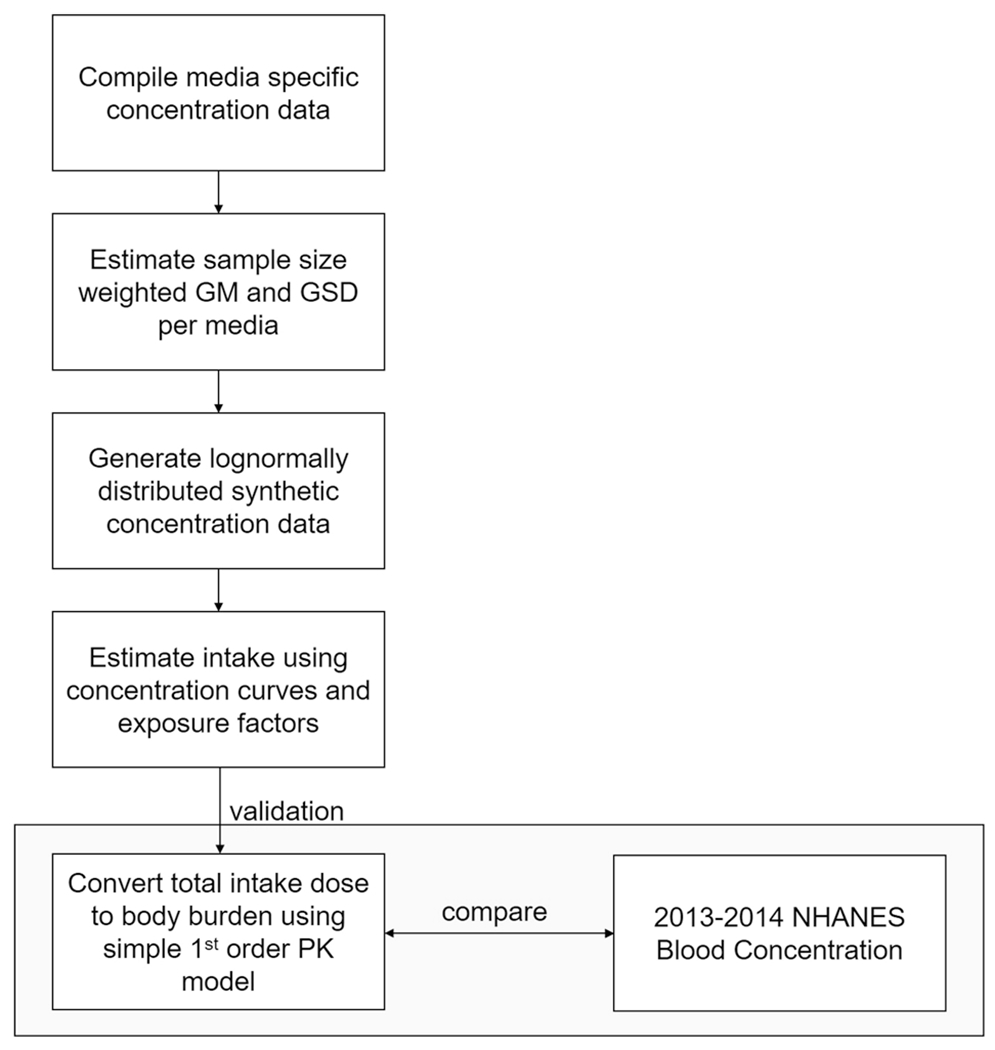
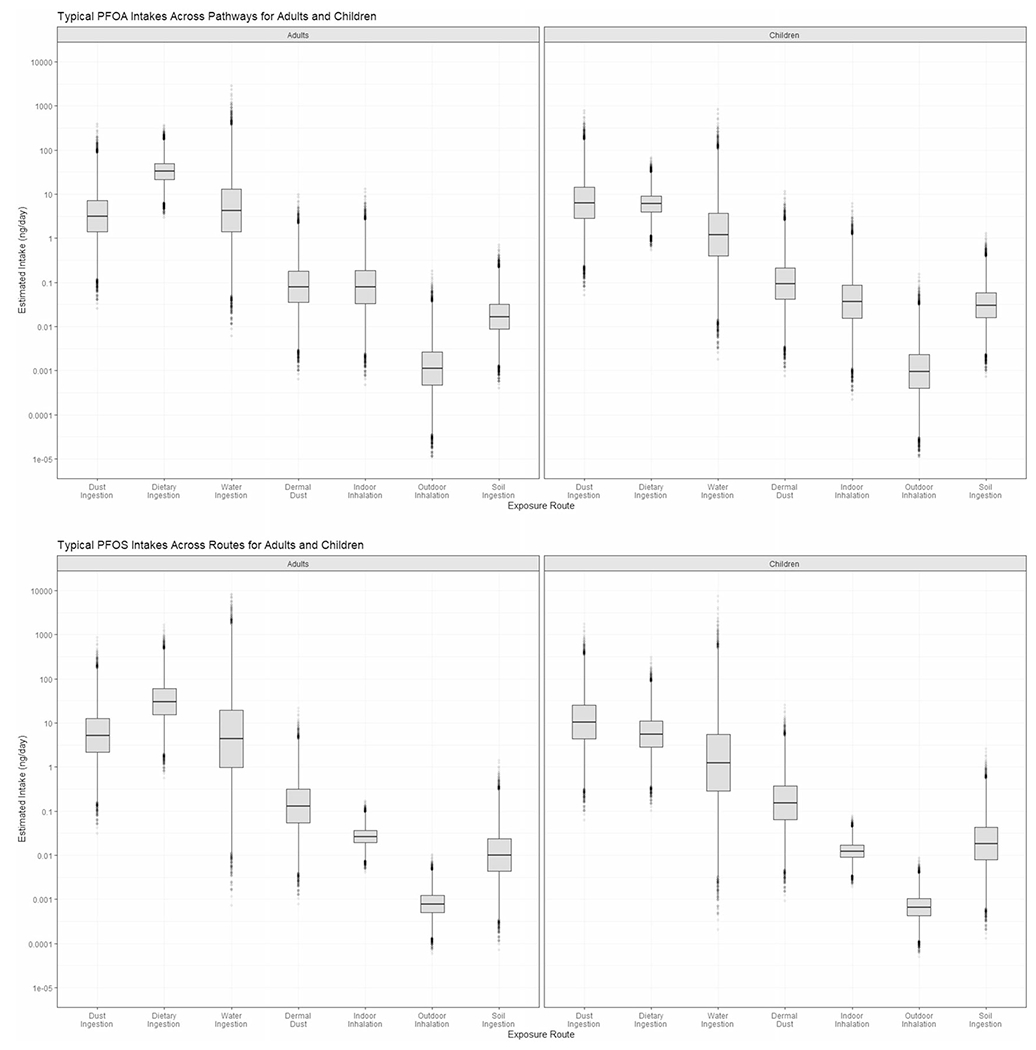
Methods: Summary statistics from secondary sources were collected, averaged, and mapped for indoor and outdoor air, water, dust, and soil for PFOA and PFOS to estimate exposures for adults and children. European dietary intake estimates were used to estimate daily intake from food.
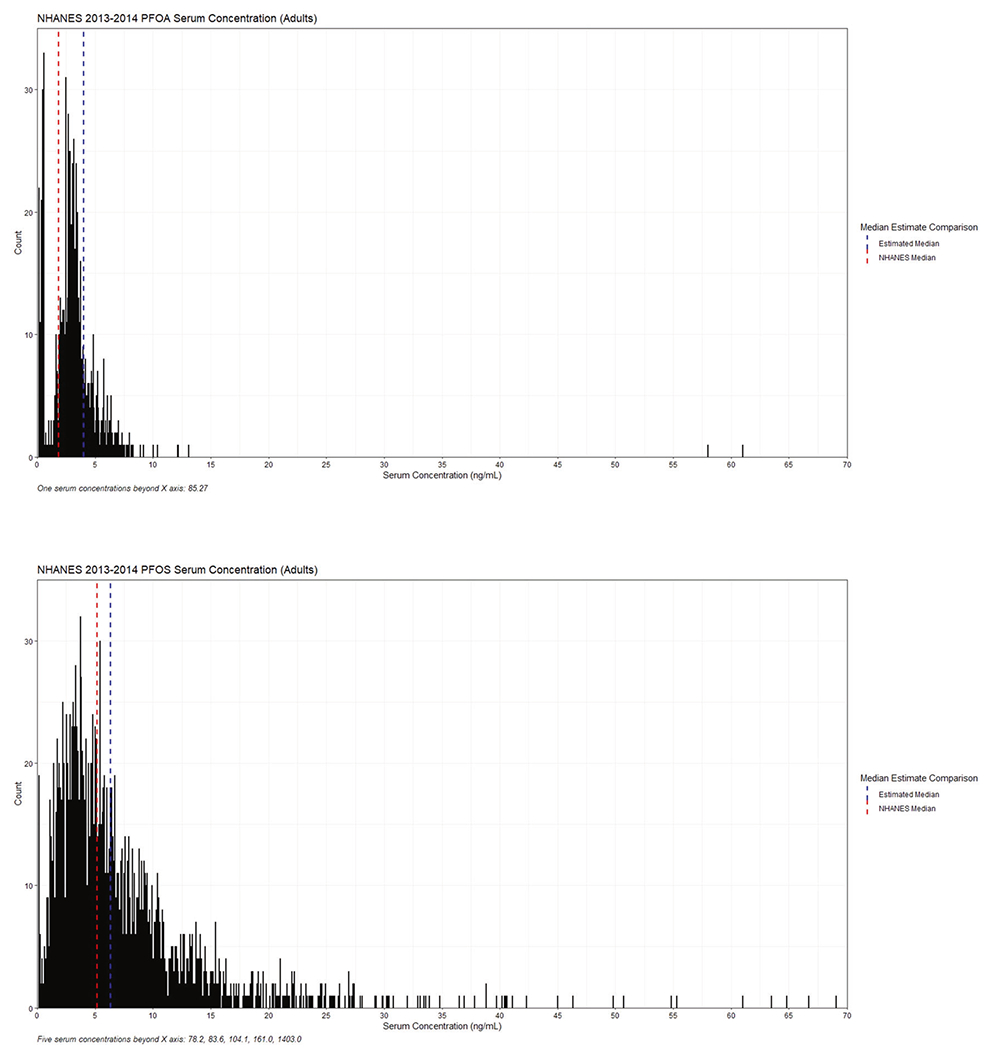
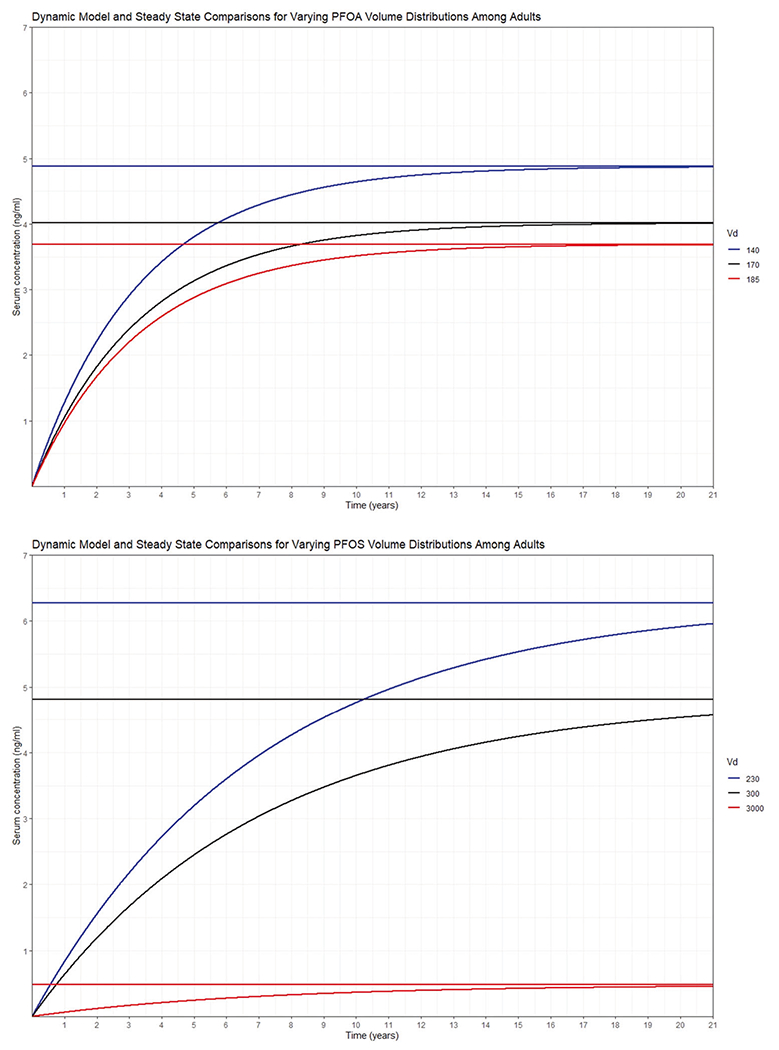
Results: In accordance with decreased concentrations in media, daily intake estimates among adults, i.e., 40 ng/day PFOA and 40 ng/day PFOS, are substantially lower than those reported previously, as are children's estimates of 14 ng/day PFOA and 17 ng/day PFOS. Using a first-order pharmacokinetic model, these results compare favorably to the National Health and Nutrition Examination Survey serum concentration measurements.
Conclusion: Concomitant blood concentrations support this enhanced estimation approach that captures the decline of PFOA/PFOS serum concentration over a decade.
Keywords: Aggregate daily; Exposure model; PFOA; PFOS.
© 2021. This is a U.S. government work and not under copyright protection in the U.S.; foreign copyright protection may apply.
Conflict of interest statement
COMPETING INTERESTS
The authors declare no competing interests.
Figures
References
-
- Agency for Toxic Substances Disease Registry. Toxicological profile for perfluoroalkyls. Draft for public comment. Updated June 2018. Atlanta, Georgia: US Department of Health and Human Services, Public Health Service. http://www.atsdr.cdc.gov/toxprofiles/tp200.pdf (2018). Accessed 31 Aug 2020.
-
- US Environmental Protection Agency. Perfluoroalkyl sulfonates; Significant New Use Rule. 40 CFR 721 ed. Federal Register; 2002. 72854–67.
-
- US Environmental Protection Agency. PFAS action plan: program update February 2020, Research Triangle Park, North Carolina: Office of Air Quality Planning & Standards. Updated February 27, 2020. https://www.epa.gov/pfas/pfas-action-plan-program-update-february-2020 (2020). Accessed 31 Aug 2020.
-
- Egeghy PP, Lorber M. An assessment of the exposure of Americans to perfluorooctane sulfonate: a comparison of estimated intake with values inferred from NHANES data. J Exposure Sci Environ Epidemiol. 2011;21:150–68. - PubMed
-
- Lorber M, Egeghy PP. Simple intake and pharmacokinetic modeling to characterize exposure of Americans to perfluoroctanoic acid, PFOA. Environ Sci Technol. 2011;45:8006–14. - PubMed
Publication types
MeSH terms
Substances
Grants and funding
LinkOut - more resources
Full Text Sources
Miscellaneous
