. 2021 Aug;7(8):1037-1049.
doi: 10.1038/s41477-021-00976-0. Epub 2021 Aug 9.

Quantitative imaging of RNA polymerase II activity in plants reveals the single-cell basis of tissue-wide transcriptional dynamics

Affiliations

Quantitative imaging of RNA polymerase II activity in plants reveals the single-cell basis of tissue-wide transcriptional dynamics

Simon Alamos et al. Nat Plants. 2021 Aug.

Abstract

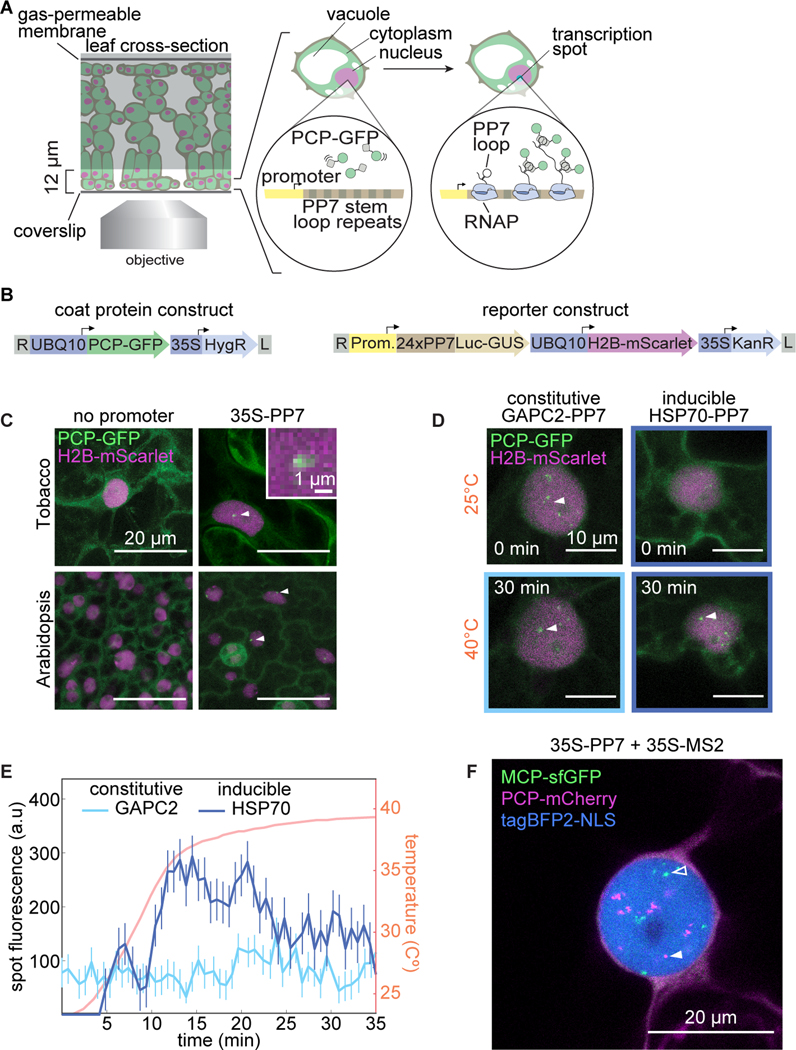
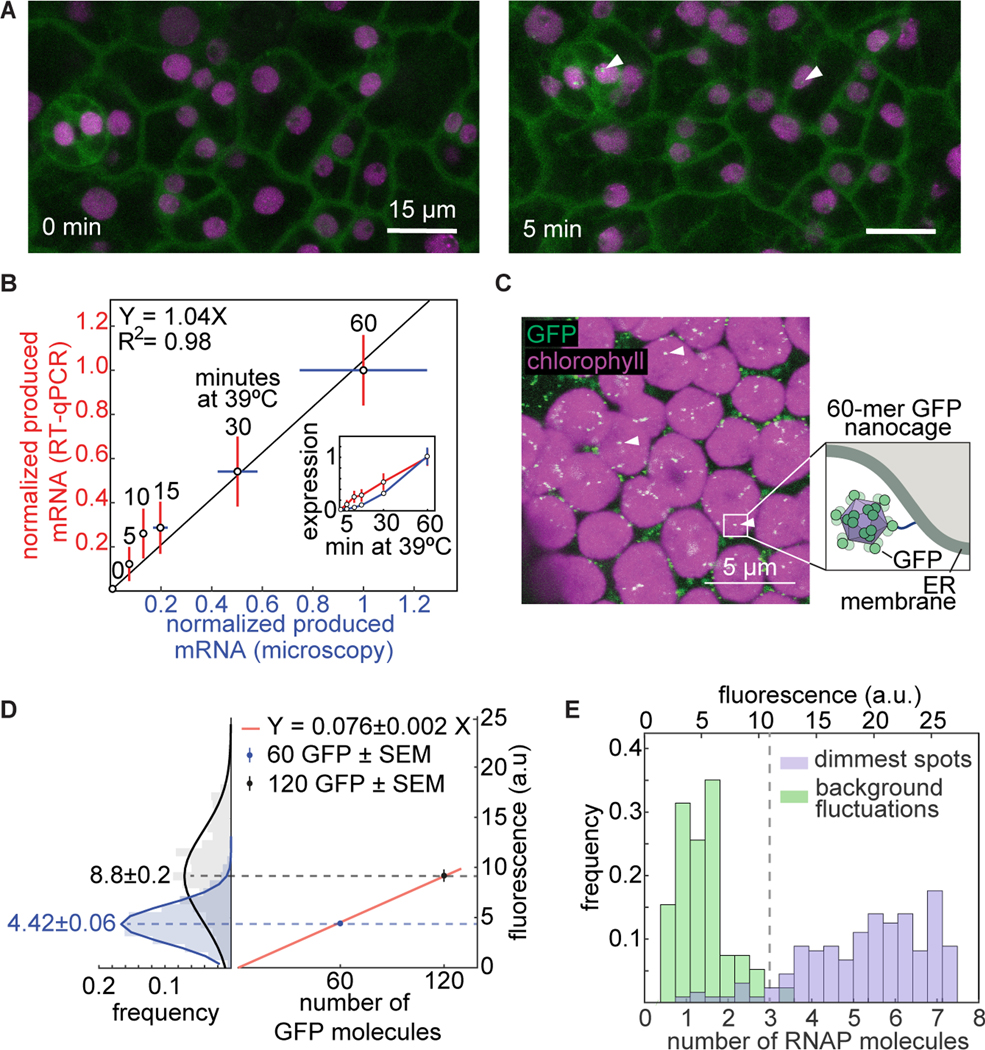
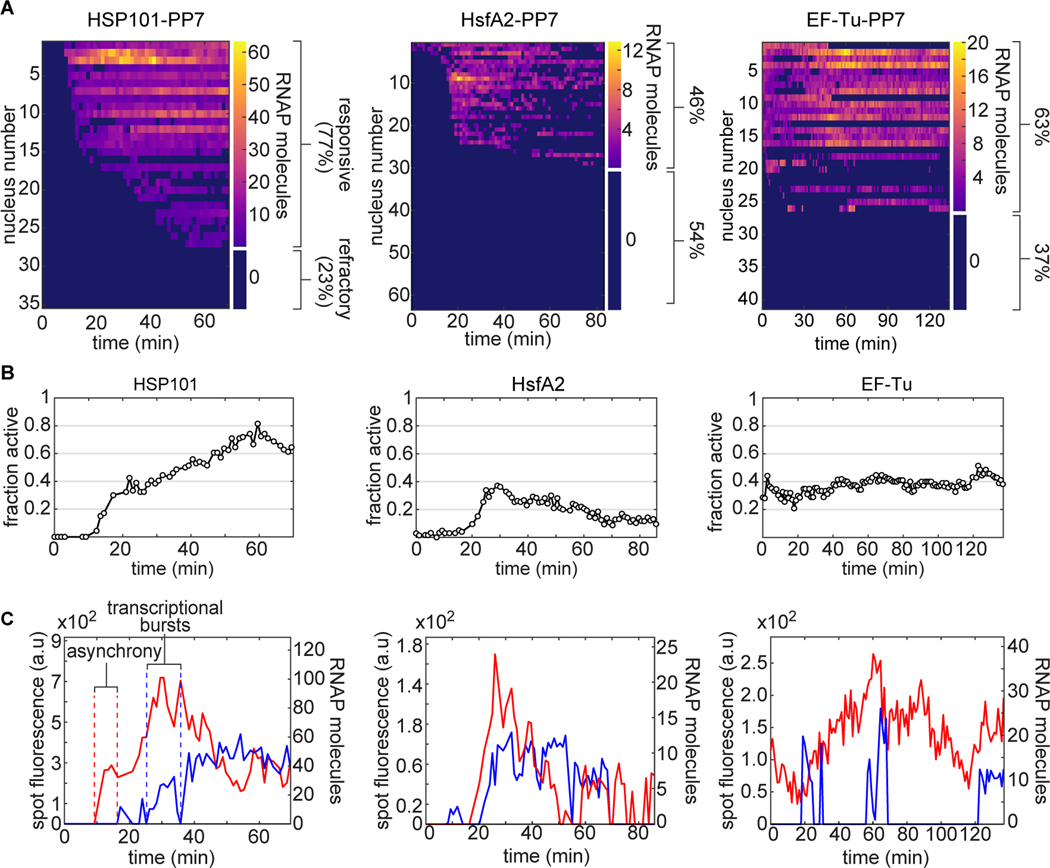
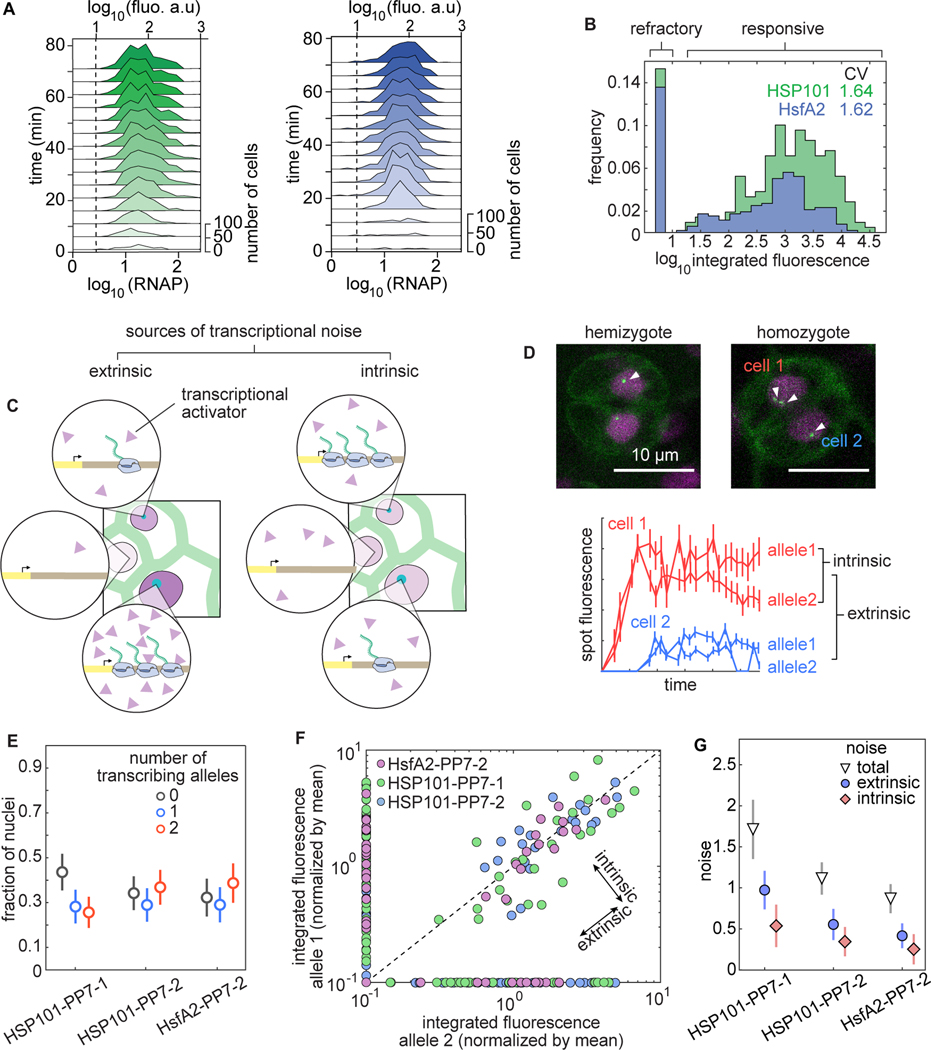
The responses of plants to their environment are often dependent on the spatiotemporal dynamics of transcriptional regulation. While live-imaging tools have been used extensively to quantitatively capture rapid transcriptional dynamics in living animal cells, the lack of implementation of these technologies in plants has limited concomitant quantitative studies in this kingdom. Here, we applied the PP7 and MS2 RNA-labelling technologies for the quantitative imaging of RNA polymerase II activity dynamics in single cells of living plants as they respond to experimental treatments. Using this technology, we counted nascent RNA transcripts in real time in Nicotiana benthamiana (tobacco) and Arabidopsis thaliana. Examination of heat shock reporters revealed that plant tissues respond to external signals by modulating the proportion of cells that switch from an undetectable basal state to a high-transcription state, instead of modulating the rate of transcription across all cells in a graded fashion. This switch-like behaviour, combined with cell-to-cell variability in transcription rate, results in mRNA production variability spanning three orders of magnitude. We determined that cellular heterogeneity stems mainly from stochasticity intrinsic to individual alleles instead of variability in cellular composition. Together, our results demonstrate that it is now possible to quantitatively study the dynamics of transcriptional programs in single cells of living plants.


Figures

Figure 1.
Figure 1.. Fluorescence labeling of nascent RNA in tobacco and Arabidopsis reveals single-cell transcriptional dynamics in real time.
(A) Schematic of the live-imaging experimental setup in leaves and diagram of the PP7 RNA labeling system. (B) Schematic of the constructs used in this study. (UBQ10, Arabidopsis ubiquitin 10 promoter; 35S, CaMV 35S promoter; HygR, hygromycin resistance; Luc-GUS, firefly luciferase-/3-glucoronidase fusion; H2B, Arabidopsis histone 2B coding sequence; KanR, kanamycin resistance; L, T-DNA left border; R, T-DNA right border). (C) Maximum projection of snapshots of cells expressing PCP-GFP and the reporter construct with or without the constitutive 35S promoter driving expression of the PP7-tagged Luc-GUS gene. White arrows indicate nuclear fluorescent puncta corresponding to transcription spots. Inset: magnification of PP7 fluorescence. (D) Maximum projection snapshots of tobacco cells expressing PCP-GFP and reporter constructs driven by the promoters of the Arabidopsis GAPC2 and HSP70 genes. Time under heat shock is indicated. White arrowheads indicate the fluorescent spots quantified in (F). (E) Fluorescence time traces of single nuclear GFP puncta in tobacco leaf epidermis cells expressing PCP-GFP and reporter constructs driven by various Arabidopsis promoters. Prior to spot detection, spots are assigned a fluorescence value of zero. Error bars represent the uncertainty in the spot fluorescence extraction (Materials and Methods). (F) Maximum projection snapshot of tobacco leaf epidermal cell expressing PCP-mCherry, MCP-GFP, H2B-tagBFP2, and two reporter constructs driven by the 35S promoter and tagged with PP7 (magenta) or MS2 (green). Open and closed arrowheads indicate MCP-tagged and PCP-tagged nascent RNAs, respectively.
Figure 2.
Figure 2.. Cross validation, absolute calibration, and sensitivity of the PP7 reporter system.
(A) Maximum fluorescence projections of leaf epidermal tissue of an Arabidopsis line stably transformed with PCP-GFP and a reporter construct driven by the HSP101 promoter under heat shock. Time stamps indicate time under heat shock. Arrowheads point to transcription spots. (B) Comparison between total mRNA produced as reported by RT-qPCR and PCP-GFP. PCP-GFP error corresponds to the standard error of the mean over 10 biological replicates; RT-qPCR error corresponds to the standard error of the mean (SEM) across three biological replicates. Data are normalized to each corresponding signal at 60 min. The solid black line shows a linear fit to the data going through the origin. The inset shows the normalized mean and SEM of expression level as a function of time for RT-qPCR and microscopy. (C) Maximum fluorescence projection of a tobacco mesophyll cell expressing a construct encoding a 60 GFP nanocage tethered to the outer membrane of the endoplasmic reticulum (ER). (D, left) Absolute calibration of GFP fluorescence. Histograms and Gaussian fit of single-nanocage fluorescence distributions for the 60-GFP (blue) and 120-GFP (black) nanocages transiently expressed in tobacco leaves. The mean of each distribution is shown next to each histogram. As expected, the means are related by a factor of two. (D, right) Mean and standard error of the mean (SEM) of the nanocage fluorescence as a function of number of GFP molecules per cage. The red line is a linear fit passing through the origin, revealing a calibration factor of 0.076 ± 0.002 a.u./GFP molecule (error reporting on the 95% confidence interval). (E) Histograms of the calibrated number of transcribing RNAP molecules in the dimmest three frames of the weakest half of HSP101-PP7 fluorescence time traces (purple) and their associated fluorescence background fluctuations (green). The point where the distributions overlap, at 3 RNAP molecules (vertical dashed line), can be considered the detection threshold.
Figure 3.
Figure 3.. Single-cell control of transcriptional activity in response to heat shock in Arabidopsis.
(A) Heat maps of spot fluorescence in all nuclei (rows) over time (columns) across the the field of view in HSP101-PP7–1, HsfA2-PP7–1, and EF-Tu-PP7–1 plants. Dark blue represents the absence of detectable signal. The size of the colorbar on the right of each heatmap shows the proportion of nuclei that exhibited activity in at least one frame during the experiment (>68 min) to refractory cells that presented no spots. (B) Instantaneous fraction of actively transcribing nuclei measured as the number of nuclei with spots divided by the total number of nuclei in the field of view. (C) Representative single-spot fluorescence time traces. Upon induction, transcriptional onset can occur asynchronously and transcriptional activity occurs in bursts, modulating the instantaneous fraction of transcriptionally active nuclei in (B).
Figure 4.
Figure 4.. Single-cell regulatory strategies determining tissue-wide transcriptional dynamics.
(A) Tissue-wide transcriptional control can be achieved through two non-exclusive regulatory modes: the graded modulation of the rate of transcription across cells, or the switch-like regulation of the fraction of actively transcribing cells. (B) Mean tissue transcription rate (left), transcription rate of active cells (middle), and instantaneous fraction of actively transcribing cells (right) for Arabidopsis lines carrying inducible promoters HSP101-PP7–1 (green) and HsfA2-PP7–1 (blue), and a line with the constitutive reporter EF-Tu-PP7–1 (red). Time t = 0 corresponds to the frame at which spots were first detected. (C) Fold-change in the mean tissue-wide transcription rate compared to the fold-change in the mean transcription rate of active cells and in the fraction of active cells, defined as the ratio between the value at its peak and at t = 10min for HSP101-PP7–1 (gray vs. green arrowheads in B) and HsfA2-PP7 (gray vs. blue arrowheads in B). The horizontal dashed line indicates a fold change of 1. (A-C, shaded regions and error bars are SEM calculated across 10, 5, and 3 experimental replicates for HSP101-PP7–1, HsfA2-PP7–1, and EF-Tu-PP7–1, respectively.)
Figure 5.
Figure 5.. Allele-specific processes explain most of the cellular heterogeneity in produced mRNA in Arabidopsis.
(A) Histograms of spot fluorescence over time for the combined replicates of Figure 4. The dashed line indicates the detection threshold determined in Figure2D. (B) Histograms of predicted total produced mRNA per cell across all replicates from Figure 4. (C) Schematic of extrinsic (left) and intrinsic (right) sources of transcriptional noise. Extrinsic noise arises from cellular differences in the abundance of regulatory molecules (purple triangles) while intrinsic noise captures differences among cells with identical composition. (D) Two-allele experiment to decompose the total transcriptional variability into intrinsic and extrinsic noise. Top: guard cells (obligate diploids) expressing HSP101-PP7. White arrowheads indicate transcription spots corresponding to one or two alleles of the reporter transgene in homologous chromosomes. In the homozygote it is possible for only one allele to be active in different cells. Bottom: spot fluorescence traces from homozygous cells shown on top. (E) Fraction of nuclei with zero, one, or two spots in heat shock-treated homozygous plants at the frame with the maximum number of visible spots. (F) Scatter plot of the integrated spot fluorescence normalized by the mean for alleles belonging to the same nucleus. Undetected spots were assigned a value of zero and plotted on the x- and y-axes. (G) Decomposition of the total variability in (F) into extrinsic and intrinsic components shows comparable contributions of both components to the total noise, with the intrinsic component explaining most of the variability. Error bars in (E) and (G) are bootstrapped errors.

Comment in

Similar articles

Cited by

References

    1. Akamatsu M, Vasan R, Serwas D, Ferrin M, Rangamani P, and Drubin DG (2020). Principles of selforganization and load adaptation by the actin cytoskeleton during clathrin-mediated endocytosis. eLife, 9:1–40. - PMC - PubMed
    1. Angel A, Song J, Dean C, and Howard M. (2011). A Polycomb-based switch underlying quantitative epigenetic memory. Nature, 476(7358):105–109. - PubMed
    1. Araújo IS, Pietsch JM, Keizer EM, Greese B, Balkunde R, Fleck C, and Hülskamp M. (2017). Stochastic gene expression in Arabidopsis thaliana . Nature Communications, 8(1):2132. - PMC - PubMed
    1. Ardehali MB and Lis JT (2009). Tracking rates of transcription and splicing in vivo. Nature Structural and Molecular Biology, 16(11):1123–1124. - PubMed
    1. Arganda-Carreras I, Kaynig V, Rueden C, Eliceiri KW, Schindelin J, Cardona A, and Seung HS (2017). Trainable Weka Segmentation: A machine learning tool for microscopy pixel classification. Bioinformatics, 33(15):2424–2426. - PubMed

MeSH terms