. 2021 Sep;53(9):1385-1391.
doi: 10.1038/s41588-021-00910-2. Epub 2021 Aug 9.

High-quality genome assembly and resequencing of modern cotton cultivars provide resources for crop improvement

Affiliations

High-quality genome assembly and resequencing of modern cotton cultivars provide resources for crop improvement

Zhiying Ma et al. Nat Genet. 2021 Sep.

Abstract

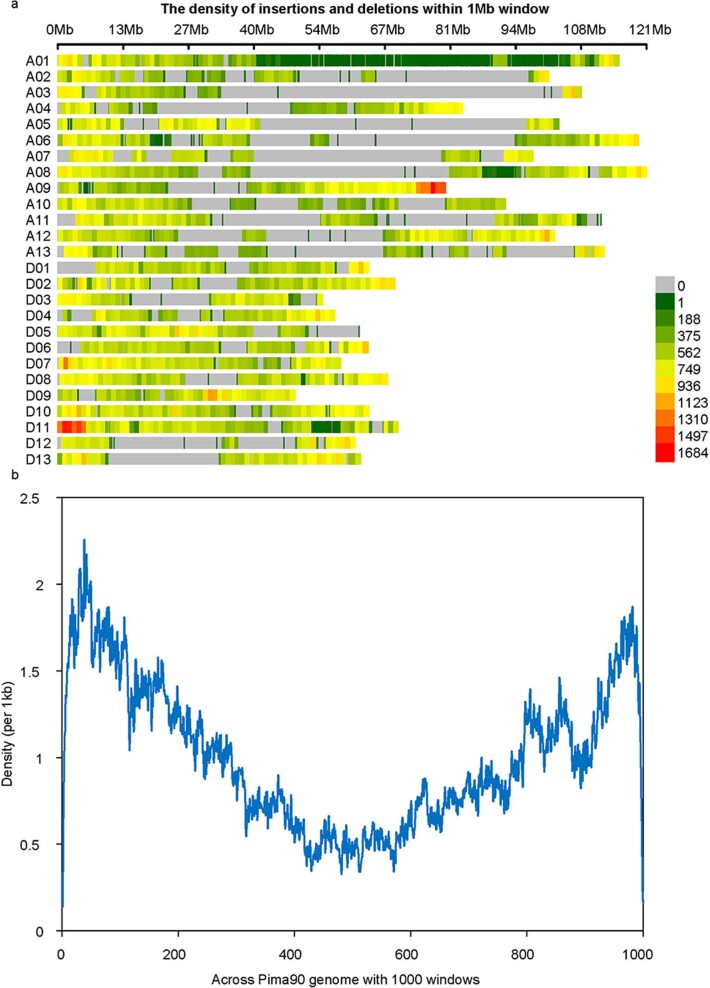
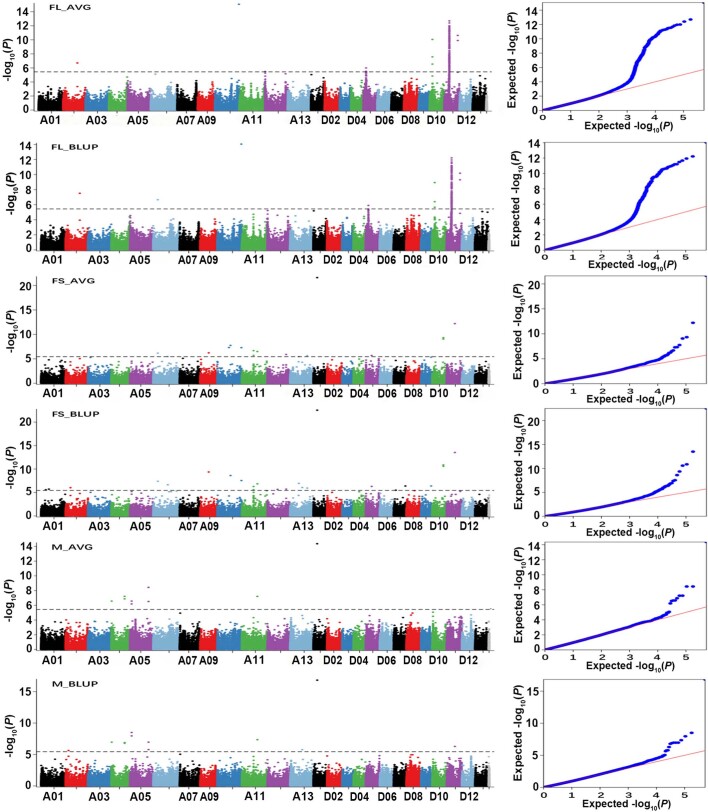
Cotton produces natural fiber for the textile industry. The genetic effects of genomic structural variations underlying agronomic traits remain unclear. Here, we generate two high-quality genomes of Gossypium hirsutum cv. NDM8 and Gossypium barbadense acc. Pima90, and identify large-scale structural variations in the two species and 1,081 G. hirsutum accessions. The density of structural variations is higher in the D-subgenome than in the A-subgenome, indicating that the D-subgenome undergoes stronger selection during species formation and variety development. Many structural variations in genes and/or regulatory regions potentially influencing agronomic traits were discovered. Of 446 significantly associated structural variations, those for fiber quality and Verticillium wilt resistance are located mainly in the D-subgenome and those for yield mainly in the A-subgenome. Our research provides insight into the role of structural variations in genotype-to-phenotype relationships and their potential utility in crop improvement.


Conflict of interest statement

The authors declare no competing interests.

Figures

Fig. 1
Fig. 1. Genomic landscape of NDM8 and TM-1_HAU genomes.
The vertical lines indicate the synteny between two genomes. Chr, Length of chromosome (Mb); DEL, density distribution of deletions; INS, density distribution of insertions; INV, density distribution of inversions; TRA, translocations between NDM8 and TM-1. The sliding windows are nonoverlapped with a 500-kb length.
Fig. 2
Fig. 2. Density distribution of insertions and deletions in NDM8 genome.
a, The density of insertions and deletions in a 1-Mb window of chromosomes. b, The density of insertions and deletions across NDM8 genome with 1,000 windows.
Fig. 3
Fig. 3. Identification of the causal gene GhNCS related to VW resistance on chromosome Dt11.
a, Manhattan plot. Dashed line represents the significance threshold (−log10(P) = 5.44). We performed statistical analysis with a two-tailed Wald test. b, Quantile-quantile plot. c, Boxplot for DI on the basis of structural variation (D11: 69329075). In the box plots, the center line denotes the median, box limits are the upper and lower quartiles and whiskers mark the range of the data; n indicates the number of accessions with the same genotype. The difference significance was analyzed by two-tailed t-test. d, Expression level of GhNCS in resistant variety ND601 inoculated with Vd LX2-1. e, qRT–PCR analysis of GhNCS in eight resistant and eight susceptible varieties under Vd stress. Ghhistone3b was used as an internal control. The data were analyzed from the total of 16 varieties and expressed as the mean from two experiments. The difference significance was analyzed by two-tailed t-test. f, Silencing of GhNCS in tolerant variety NDM8 and susceptible variety CCRI8 led to obviously increased resistance compared with the mock. Scale bar, 5 cm. g, For each independent virus-induced gene silencing experiment, 35 cotton seedlings with higher silent efficiency were used for VW disease resistance detection. h, GhNCS overexpressed in Arabidopsis made transgenic plants highly susceptible compared with the wild type. Scale bar, 5 cm.
Extended Data Fig. 1
Extended Data Fig. 1. Chromatin interactions in each chromosome of G. hirsutum NDM8.
Each heatmap is shown at a resolution of 100 kb. The dark red dots show the high probability of interaction, and the light dots show the low probability of interaction.
Extended Data Fig. 2
Extended Data Fig. 2. Chromatin interactions in each chromosome of G. barbadense Pima90.
Each heatmap is shown at a resolution of 100 kb. The dark red dots show the high probability of interaction, and the light dots show the low probability of interaction.
Extended Data Fig. 3
Extended Data Fig. 3. Comparison of Hi-C directed chromosome assembly with a published genetic map between G. hirsutum and G. barbadense for each chromosome in NDM8.
The x-axes represent the physical positions of the sequences (Mb) and the y-axes represent the positions of the sequences on the genetic map (cM).
Extended Data Fig. 4
Extended Data Fig. 4. Comparison of Hi-C directed chromosome assembly with a published genetic map between G. hirsutum and G. barbadense for each chromosome in Pima90.
The x-axes represent the physical positions of the sequences (Mb) and the y-axes represent the positions of the sequences on the genetic map (cM).
Extended Data Fig. 5
Extended Data Fig. 5. The number of differentially expressed genes in variant-gene pairs.
a, The number of differentially expressed genes with the insertion and deletion in gene and/or regulatory regions. b, The expression of GbM_D08G1627, GbM_A12G2140 and GbM_A04G0106.
Extended Data Fig. 6
Extended Data Fig. 6. The structure of sucrose synthase (Sus) gene in Pima90 and NDM8, and expression analysis of different stages in cotton fiber development.
a, Comparison of Sus gene sequences among ancestral diploid species and cultivated tetraploid cottons. b, The conservative structures of the Sus in Pima90 and NDM8, respectively. The blue shadow rectangle indicated transmembrane region within GbM_D13G2394. c, The transcriptome of Sus gene in cotton varieties with different fiber quality during fiber developmental stages. The Sus in Pima90 with super fiber quality showed higher expression level than that in NDM8 (good fiber quality) and ND601 (common fiber quality).
Extended Data Fig. 7
Extended Data Fig. 7. Density distribution of insertions and deletions in Pima90.
a, The density of insertions and deletions within 1 Mb window of chromosomes. b, The density of insertions and deletions across Pima90 genome with 1,000 windows.
Extended Data Fig. 8
Extended Data Fig. 8. The structural variation of CCR gene (GhM_A02G1731 versus Ghir_A02G014590).
a, The location of structural variation in the genome of NDM8 against TM-1. b, The structural variation led to the difference in the open reading frame (ORF) between NDM8 and TM-1, and the conservative structure domain (NAD_binding_10) of CCR in NDM8. c, Three-dimensional structure of CCR (GhM_A02G1731) was obtained by homologous modeling. The second deletion (508–552) in TM-1 influenced the formation of CCR structure within NAD-binding domain that was indicated by red dotted line. d, Expression of CCR in resistant (NDM8) and susceptible (TM-1) cotton varieties under V. dahliae stress through qRT–PCR. Ghhistone3b was used as an internal control. e, Comparison of CCR genomic sequences among ancestral diploid species and cultivated tetraploid cottons. f, Comparison of CCR partial coding sequences among ancestral diploid species and cultivated tetraploid cottons.
Extended Data Fig. 9
Extended Data Fig. 9. GWAS of fiber quality related traits based on accessions and structural variations.
Manhattan plots and Quantile-Quantile plots using mean (AVG) and BLUP values of all environments. The genome-wide significant -log10(P) = 5.44 is indicated by the gray dotted line. FL, fiber length; FS, fiber strength; M, micronaire value. The statistical analysis was performed with two-tailed Wald test.
Extended Data Fig. 10
Extended Data Fig. 10. GWAS of yield related traits based on accessions and structural variations.
Manhattan plots and Quantile-Quantile plots using mean (AVG) and BLUP values of all environments. The genome-wide significant -log10(P) = 5.44 is indicated by the gray dotted line. BW, boll weight; LP, lint percentage; SI, seed index. The statistical analysis was performed with two-tailed Wald test.

References

    1. Chen ZJ, et al. Toward sequencing cotton (Gossypium) genomes. Plant Physiol. 2007;145:1303–1310. doi: 10.1104/pp.107.107672. - DOI - PMC - PubMed
    1. Fang L, et al. Genomic analyses in cotton identify signatures of selection and loci associated with fiber quality and yield traits. Nat. Genet. 2017;49:1089–1098. doi: 10.1038/ng.3887. - DOI - PubMed
    1. International Wheat Genome Sequencing Consortium. Shifting the limits in wheat research and breeding using a fully annotated reference genome. Science361, eaar 7191 (2018). - PubMed
    1. Wang MJ, et al. Reference genome sequences of two cultivated allotetraploid cottons, Gossypium hirsutum and Gossypium barbadense. Nat. Genet. 2019;51:224–229. doi: 10.1038/s41588-018-0282-x. - DOI - PubMed
    1. Hu Y, et al. Gossypium barbadense and Gossypium hirsutum genomes provide insights into the origin and evolution of allotetraploid cotton. Nat. Genet. 2019;51:739–748. doi: 10.1038/s41588-019-0371-5. - DOI - PubMed

Publication types