. 2021 Jul 13;11(17):8152-8171.
doi: 10.7150/thno.55334. eCollection 2021.

Fructose-coated Ångstrom silver prevents sepsis by killing bacteria and attenuating bacterial toxin-induced injuries

Affiliations

Fructose-coated Ångstrom silver prevents sepsis by killing bacteria and attenuating bacterial toxin-induced injuries

Hao Yin et al. Theranostics. .

Abstract

Serious infection caused by multi-drug-resistant bacteria is a major threat to human health. Bacteria can invade the host tissue and produce various toxins to damage or kill host cells, which may induce life-threatening sepsis. Here, we aimed to explore whether fructose-coated Ångstrom-scale silver particles (F-AgÅPs), which were prepared by our self-developed evaporation-condensation system and optimized coating approach, could kill bacteria and sequester bacterial toxins to attenuate fatal bacterial infections. Methods: A series of in vitro assays were conducted to test the anti-bacterial efficacy of F-AgÅPs, and to investigate whether F-AgÅPs could protect against multi-drug resistant Staphylococcus aureus (S. aureus)- and Escherichia coli (E. coli)-induced cell death, and suppress their toxins (S. aureus hemolysin and E. coli lipopolysaccharide)-induced cell injury or inflammation. The mouse models of cecal ligation and puncture (CLP)- or E. coli bloodstream infection-induced lethal sepsis were established to assess whether the intravenous administration of F-AgÅPs could decrease bacterial burden, inhibit inflammation, and improve the survival rates of mice. The levels of silver in urine and feces of mice were examined to evaluate the excretion of F-AgÅPs. Results: F-AgÅPs efficiently killed various bacteria that can cause lethal infections and also competed with host cells to bind with S. aureus α-hemolysin, thus blocking its cytotoxic activity. F-AgÅPs inhibited E. coli lipopolysaccharide-induced endothelial injury and macrophage inflammation, but not by directly binding to lipopolysaccharide. F-AgÅPs potently reduced bacterial burden, reversed dysregulated inflammation, and enhanced survival in mice with CLP- or E. coli bloodstream infection-induced sepsis, either alone or combined with antibiotic therapy. After three times injections within 48 h, 79.18% of F-AgÅPs were excreted via feces at the end of the 14-day observation period. Conclusion: This study suggests the prospect of F-AgÅPs as a promising intravenous agent for treating severe bacterial infections.

Keywords: bacterial infection; inflammation; lipopolysaccharide; Ångstrom-scale silver particles; α-hemolysin.


Conflict of interest statement

Competing Interests: The authors have declared that no competing interest exists.

Figures

Figure 1
Figure 1
Characterization of AgÅPs and F-AgÅPs. (A) Morphologies of AgÅPs and F-AgÅPs detected by TEM. Scale bar: 20 nm. (B) Diameters of AgÅPs (14.43 ± 8.14 Ång; n = 97) and F-AgÅPs (9.09 ± 3.27 nm; n = 107) measured from TEM images. (C) XRD patterns of AgÅPs and F-AgÅPs. (D) Elemental composition of AgÅPs and F-AgÅPs assessed by EDS. (E-F) UV-Vis-NIR (E) and FT-IR (F) spectra of AgÅPs and F-AgÅPs. (G) DLS analysis of the zeta potential of F-AgÅPs. (H) Digital photos of AgÅPs and F-AgÅPs in deionized water left for one month at room temperature. White arrow indicates the aggregates formed by AgÅPs. (I) ICP-MS analysis of silver concentration in the supernatant of AgÅPs and F-AgÅPs solution at day 0 and day 30. n = 3 per group. ***P < 0.001.
Figure 2
Figure 2
Effects of F-AgÅPs on bacterial growth, survival, and structural integrity. (A) Diameters of inhibition zones around the paper disks infiltrated with vehicle (normal saline) or F-AgÅPs. n = 3 per group. MDR: multi-drug-resistant. (B) MIC and MBC values of F-AgÅPs against different bacteria. n = 3 per group. (C) Images of bacterial colonies on agar plates formed by the vehicle (normal saline)-, F-AgÅPs-, or AgNPs-treated multi-drug-resistant S. aureus or E. coli in LB medium. Bacterial colony numbers were counted. n = 3 per group. (D) Calcein-AM/PI staining images of the vehicle (normal saline)-, F-AgÅPs-, or AgNPs-treated multi-drug-resistant S. aureus or E. coli and quantification of the percentage of live (calcein-AM+PI-) bacteria. Scale bar: 10 μm. n = 3 per group. (E) Survival rate of bacteria assessed by alamar blue assay. n = 4 per group. (F) Images of bacterial colonies formed by the vehicle (normal saline)-, F-AgÅPs-, or AgNPs-treated multi-drug-resistant S. aureus or E. coli in mouse blood and quantification of the numbers of bacterial colonies. n = 3 per group. (G-H) Morphological features (G) and in situ elemental composition analysis (H) of the vehicle (normal saline)-, F-AgÅPs-, or AgNPs-treated multi-drug-resistant S. aureus or E. coli by TEM combined with EDS. Scale bar: 500 nm. ***P < 0.001.
Figure 3
Figure 3
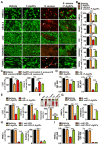
F-AgÅPs attenuate bacteria or bacterial toxins-induced cell injuries. (A) Calcein-AM/PI staining images of a class of human or mouse cells treated with vehicle, F-AgÅPs, S. aureus, or S. aureus + F-AgÅPs. Vehicle indicates normal saline (solvent of F-AgÅPs) + un-cultured medium (for culturing S. aureus). White arrows indicate live bacteria-like signals inside or around the dead recipient cells. Scale bar: 100 μm. (B) The ratios of calcein-AM+PI- live cells in (A). n = 3 per group. (C) The ratios of calcein-AM+PI- live LO2 and bEnd.3 cells in vehicle, S. aureus-CS, F-AgÅPs-pretreated S. aureus-CS, and F-AgÅPs + S. aureus-CS treatment groups. S. aureus-CS: S. aureus-derived culture supernatant. Vehicle indicates normal saline (solvent of F-AgÅPs) + un-cultured medium (for culturing S. aureus). n = 3 per group. (D) CCK-8 analysis of cell survival/growth in vehicle, F-AgÅPs, α-HL, and α-HL + F-AgÅPs treatment groups. α-HL: α-hemolysin. Vehicle indicates normal saline (solvent of F-AgÅPs) + PBS (solvent of α-HL). n = 4 per group. (E) The ratios of calcein-AM+PI- live cells in vehicle (normal saline + PBS), F-AgÅPs, α-HL, and α-HL + F-AgÅPs treatment groups. n = 3 per group. (F) Digital photos of RBC suspension and the hemolytic rates based on the relative absorbance of free hemoglobin at 541 nm. RBC treated with water (H2O: positive control) or PBS (negative control) served as controls. n = 3 per group. (G) The ratios of calcein-AM+PI- live cells in vehicle, F-AgÅPs, E. coli, and E. coli + F-AgÅPs treatment groups. Vehicle indicates normal saline (solvent of F-AgÅPs) + PBS (solvent of LPS). n = 3 per group. (H) The ratios of calcein-AM+PI- live cells in vehicle (normal saline + PBS), F-AgÅPs, E. coli LPS, and E. coli LPS + F-AgÅPs treatment groups. n = 3 per group. (I) CCK-8 analysis of cell survival/growth in different treatment groups. n = 4 per group. **P < 0.01, ***P < 0.001.
Figure 4
Figure 4
F-AgÅPs bind to S. aureus α-hemolysin to inhibit its activity and down-regulate LPS-induced macrophage inflammation. (A) Analysis of α-hemolysin content by ELISA. n = 3 per group. (B) Gross observation and the hemolytic rates in RBC treated with PBS, H2O, vehicle (normal saline) or F-AgÅPs-pretreated α-HL, or α-HL-reduced supernatant. α-HL: α-hemolysin. n = 3 per group. (C) CCK-8 analysis of cell survival/growth in vehicle (normal saline + PBS), vehicle (normal saline)- or F-AgÅPs-pretreated α-HL, and α-HL-reduced supernatant treatment groups. n = 4 per group. (D) The ratios of calcein-AM+PI- live cells in different treatment groups. n = 3 per group. (E) Analysis of E. coli LPS content by ELISA. n = 3 per group. (F) qRT-PCR analysis of Il-1α, Il-1β, Il-6, Tnf-α, and Il-10 gene expression in RAW264.7 macrophages treated with vehicle, F-AgÅPs, E. coli LPS, or E. coli LPS + F-AgÅPs. Vehicle indicates normal saline (solvent of F-AgÅPs) + PBS (solvent of LPS). n = 3 per group. (G) Protein levels of IL-6, IL-12p70, TNF-α, MCP-1, and IFN-γ measured by a CBA inflammation kit combined with flow cytometry. n = 3 per group. ***P < 0.001.
Figure 5
Figure 5
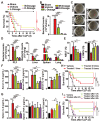
F-AgÅPs alleviate CLP-induced fatal sepsis. (A) Survival curves of the vehicle-treated sham mice and CLP mice treated with F-AgÅPs or vehicle one time at 2 h after surgery. H-Dosage: high dosage; M-Dosage: middle dosage; L-Dosage: low dosage. Vehicle indicates normal saline (solvent of F-AgÅPs). n = 10 per group. (B-C) Blood samples from sham or CLP mice receiving different treatments at 24 h after surgery were spread onto agar plates. Bacterial colony numbers were shown in (B) and the representative images of bacterial colonies were displayed in (C). n = 5 per group. (D) The numbers of bacterial colonies detected in PLF and homogenates of liver, spleen, and lung. n = 5 per group. (E) The percentages of neutrophils (NEUT) and lymphocytes (LYMPH) assessed by routine blood test. n = 5 per group. (F-G) Protein level analysis of IL-6, TNF-α, and IL-10 in blood (G) and spleen homogenates (G) by a CBA inflammation kit. n = 5 per group. (H) Survival curves of CLP mice treated with vehicle (normal saline) or middle dose of F-AgÅPs for one time (at 2 h after surgery), two times (at 2 h and 24 h after surgery) or three times (at 2 h, 24 h and 48 h after surgery). n = 10 per group. (I) Survival curves of CLP mice receiving three times injections of vehicle (normal saline) or middle dose of F-AgÅPs started at 2 h, 12 h, 24 h, or 48 h after surgery. n = 10 per group. *P < 0.01, **P < 0.01, ***P < 0.001.
Figure 6
Figure 6
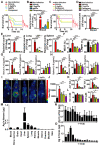
F-AgÅPs protect against lethal E. coli bloodstream infection. (A) Survival curves of the vehicle-treated non-infected mice and the carbapenem-resistant E. coli-infected mice receiving three times injections of vehicle, F-AgÅPs, AgNPs, or panipenem. Vehicle indicates normal saline (solvent of F-AgÅPs). n = 10 per group. (B) The numbers of bacterial colonies detected in blood samples from mice in (A) at 24 h after infection. n = 5 per group. (C) Survival curves of the vehicle-treated non-infected mice and the carbapenem-sensitive multi-drug resistant ESBL-producing E. coli-infected mice receiving three times injections of vehicle, F-AgÅPs, panipenem, or F-AgÅPs + panipenem. Vehicle indicates normal saline (solvent of F-AgÅPs). n = 10 per group. (D) The numbers of bacterial colonies detected in blood samples from mice in (C) at 24 h after infection. n = 5 per group. (E) The numbers of bacterial colonies detected in homogenates of liver, spleen, and lung tissues. n = 5 per group. (F) The values of NEUT% and LYMPH% tested by routine blood test. n = 6-7 per group. (G-H) Protein level analysis of IL-6, TNF-α, and IL-10 in blood (G) and spleen homogenates (H) by a CBA inflammation kit. n = 5 per group. (I) Representative PET/CT images of the vehicle (normal saline)-treated non-infected mice and the E. coli-infected mice in different groups at 20 min after injection of 18F-FDG. (J) Quantification of the standardized uptake value (SUV) for 18F-FDG in the areas of spleen tissues. n = 3-5 per group. (K-L) The serum levels of indicators revealing liver (ALT and AST; K) and kidney (SCr and BUN; L) injuries. n = 4-5 per group. (M) ICP-MS analysis of silver contents in blood, bone marrow, and major tissues from the F-AgÅPs-treated E. coli-infected mice at days 14 after infection. n = 4. (N-O) Daily excretion levels of silver in urine (N) and feces (O) during the 14-day observation period. n = 4-5. *P < 0.01, **P < 0.01, ***P < 0.001.

References

    1. Fernandes MM, Carvalho EO, Lanceros-Mendez S. Electroactive smart materials: novel tools for tailoring bacteria behavior and fight antimicrobial resistance. Front Bioeng Biotechnol. 2019;7:277. - PMC - PubMed
    1. Craft KM, Townsend SD. The human milk glycome as a defense against infectious diseases: rationale, challenges, and opportunities. ACS Infect Dis. 2018;4:77–83. - PMC - PubMed
    1. Furst AL, Francis MB. Impedance-based detection of bacteria. Chem Rev. 2019;119:700–26. - PubMed
    1. Gollomp K, Sarkar A, Harikumar S, Seeholzer SH, Arepally GM, Hudock K. et al. Fc-modified HIT-like monoclonal antibody as a novel treatment for sepsis. Blood. 2020;135:743–54. - PMC - PubMed
    1. Zhang CY, Dong X, Gao J, Lin W, Liu Z, Wang Z. Nanoparticle-induced neutrophil apoptosis increases survival in sepsis and alleviates neurological damage in stroke. Sci Adv. 2019;5:eaax7964. - PMC - PubMed

Publication types

MeSH terms