. 2021 Jul 25;11(17):8350-8361.
doi: 10.7150/thno.51456. eCollection 2021.

Ligase 1 is a predictor of platinum resistance and its blockade is synthetically lethal in XRCC1 deficient epithelial ovarian cancers

Affiliations

Ligase 1 is a predictor of platinum resistance and its blockade is synthetically lethal in XRCC1 deficient epithelial ovarian cancers

Reem Ali et al. Theranostics. .

Abstract

Rationale: The human ligases (LIG1, LIG3 and LIG4) are essential for the maintenance of genomic integrity by catalysing the formation of phosphodiester bonds between adjacent 5'-phosphoryl and 3'-hydroxyl termini at single and double strand breaks in duplex DNA molecules generated either directly by DNA damage or during replication, recombination, and DNA repair. Whether LIG1, LIG3 and LIG4 can influence ovarian cancer pathogenesis and therapeutics is largely unknown. Methods: We investigated LIG1, LIG3 and LIG4 expression in clinical cohorts of epithelial ovarian cancers [protein level (n=525) and transcriptional level (n=1075)] and correlated to clinicopathological features and survival outcomes. Pre-clinically, platinum sensitivity was investigated in LIG1 depleted ovarian cancer cells. A small molecule inhibitor of LIG1 (L82) was tested for synthetic lethality application in XRCC1, BRCA2 or ATM deficient cancer cells. Results: LIG1 and LIG3 overexpression linked with aggressive phenotypes, platinum resistance and poor progression free survival (PFS). In contrast, LIG4 deficiency was associated with platinum resistance and worse PFS. In a multivariate analysis, LIG1 was independently associated with adverse outcome. In ovarian cancer cell lines, LIG1 depletion increased platinum cytotoxicity. L82 monotherapy was synthetically lethal in XRCC1 deficient ovarian cancer cells and 3D-spheroids. Increased cytotoxicity was linked with accumulation of DNA double strand breaks (DSBs), S-phase cell cycle arrest and increased apoptotic cells. L82 was also selectively toxic in BRCA2 deficient or ATM deficient cancer cells and 3D-spheroids. Conclusions: We provide evidence that LIG1 is an attractive target for personalization of ovarian cancer therapy.

Keywords: DNA repair; LIG1; LIG1 inhibitor; LIG3; LIG4; Ovarian cancer; Predictive bimarker; Prognostics; Synthetic lethality.


Conflict of interest statement

Competing Interests: The authors have declared that no competing interest exists.

Figures
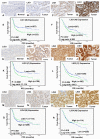
Figure 1
Figure 1
Expression of LIG1by immunohistochemistry in tissue microarray images. A) Negative LIG1 staining in normal ovarian tissue, B) weak nuclear LIG1 staining in tumor, C) moderate nuclear LIG1 staining staining in tumor, D) strong nuclear LIG1 staining staining in tumor. All images were captured at 20-times magnifications. (E)Kaplan Meier curves for LIG1 nuclear expression and progression free survival (PFS). (F) Kaplan Meier curves for LIG1nuclear expression and overall survival (OS). Expression of LIG3 by immunohistochemistry in tissue microarray images. G) Negative LIG3 staining in normal ovarian tissue, H) weak LIG3 staining in tumor, I) moderate LIG3 in tumor, J) strong LIG3 staining in tumor. All images were captured at 20-times magnifications. (K) Kaplan Meier curves for LIG3 cytoplasmic expression alone and progression free survival (PFS). (L) Kaplan Meier curves for LIG3 cytoplasmic expression alone and overall survival (OS). Expression of LIG4 by immunohistochemistry in tissue microarray images. M) Negative LIG4 staining in normal ovarian tissue, N) weak LIG4 staining in tumor, O) moderate LIG4 staining in tumor and P) strong LIG4 staining in tumor. All images were captured at 20-times magnifications. (Q) Kaplan Meier curves for LIG4 nuclear expression and progression free survival (PFS). (R) Kaplan Meier curves for LIG4 nuclear expression and overall survival (OS). All p-values were generated by log-rank.
Figure 2
Figure 2
(A) Clonogenic survival assay for A2780, A2780cis, PEO1&PEO4 cells in different doses of cisplatin. (B) Western blot for LIG1 expression in A2780, A2780cis, PEO1&PEO4 cells. (C) Quantification of LIG1protein levels is shown here. (D) Western blot for LIG1 protein levels in A2780 cells treated with Cisplatin (5 μM) Lysates were collected at 24 and 48 hrs post treatment. (E) Quantification of LIG1 protein levels by western blot in A2780 cells treated with Cisplatin. (H) Western blot for LIG1 knockdown in A2780 cells. Cells were plated in T25 flasks overnight and transfected with scrambled control or LIG1 siRNA. Transfection efficiency was confirmed by western blotting at day3 and day 5. Figures are representative of 3 or more independent experiments. (I) Clonogenic survival assay for Cisplatin sensitivity in A2780 control and LIG1 knock down (p-value was calculated as an average across control and KD cell line). (J) Quantification of γH2AX positive cells by flow cytometry in A2780 cells control and LIG1_ knock down treated with 5µM cisplatin for 24 h. (K) Cell cycle analysis by flow cytometry in A2780 cells control and LIG1_ knockdown treated with5 μM cisplatin. (L) AnnexinV analysis for apoptotic cells in A2780 cells control and LIG1_ knock down treated with5 μM cisplatin. (M) LIG1 knock down by siRNA in A2780cis cells. (N) Clonogenic survival assay for Cisplatin sensitivity in A2780cis control and LIG1 knock down. (O) Western blot for LIG1 protein levels in A2780cis cells treated with Cisplatin (5 μM). Lysates were collected at 24 and 48 hrs post treatment. (N) Quantification of LIG1 protein levels by western blot in A2780cis cells treated with Cisplatin. (O) Quantification of γH2AX positive cells by flow cytometry in A2780cis cells control and LIG1_ knock down treated with 5µM cisplatin for 24 h. (P) Cell cycle analysis by flow cytometry in A2780cis cells control and LIG1_ knockdown treated with5 μM cisplatin. (Q) Annexin V analysis for apoptotic cells in A2780cis cells control and LIG1_ knock down treated with5 μM cisplatin. cells were seeded overnight transfected with scrambled control or LIG1 siRNA. At day 3 controls and knockdown cells were re platted in 6-well plates overnight and treated with 5 μM cisplatin and analyzed by flow cytometry on day 5. Figures are representative of 3 or more independent experiments. Error bars represents standard error of mean (SEM) between experiments. '*' = P - values < 0.05, '**' = P- values < 0.01.
Figure 3
Figure 3
(A) LIG1 is involved in DNA replication (has03030), base excision repair (hsa03410), nucleotide excision repair (hsa03420) and mismatch repair (hsa03430). We assessed the mutation status of all 93 genes involved in these pathways (Supplemental Table S6). Coding variants including frameshift, stop gain and substitution variants were identified in the genes encoding APEX2, EXO1, LIG3, PARP3, POLA1, POLB, POLD1, POLE, RPA2. The Genemania plugin for Cytoscape was used to generate a pathway map identifying LIG1 and its functionally associated genes which harbor coding variants in Pt resistant A2780cis and PE04 cell lines. The protein nodes indicated in yellow cicles are those LIG1 interactors with variants associated with Pt resistance in these cell lines. No variants were identified in those variants shaded in grey circles. All nodes are scaled to indicated connectedness, that it is to say the number of interactions identified. Inferred pathways are indicated as grey diamond. (B) LIG1 co-immunoprecipitation with XRCC1 and RPA in A2780, A2780cis,PEO1. (C) Kaplan Meier curves for LIG1 & XRCC1 co-expression and PFS. (D) Kaplan Meier curves for LIG1 & XRCC1 co-expression and OS.
Figure 4
Figure 4
(A) Clonogenics survival assay for L82 sensitivity in A2780 control and A2780 (XRCC1_KO) (p-value was calculated as an average across control and KD cell line). (B) Representative photo micrographic images for immunofluorescence staining of γH2AX and 53BP1 in A2780 control and A2780 (XRCC1_KO) cells treated with L82 (10 μM) for 24 hrs. (C) Quantification of 53BP1 nuclear fluorescence by ImageJ software. (D) Quantification of γH2AX foci/cell by ImageJ software. Quantification of γH2AX positive cells by flow cytometry (E), Cell cycle analysis by flow cytometry (F) & Annexin V analysis by flow cytometry (G) in A2780 control and A2780 (XRCC1_KO) treated with L82 (10 μM) for 24 hrs. (H) Representative photomicrographic images of A2780 control and A2780 (XRCC1_KO) 3D-spheres treated with 10 μM of L82. (I) Quantification of spheroids size by ImageJ software. (J) quantification of spheroids cell viability by flow cytometry. (K) Olaparib sensitivity in A2780_Control and A2780_XRCC1_KO cells. (L) Cytotoxicity of Olaparib + L82 combination in A2780_Control and A2780_XRCC1_KO cells. Figures are representative of 3 or more experiments. Error bars represent standard error of mean between experiments. '*' = P-values < 0.05, '**' = P-values < 0.01, '***' = P-values < 0.001.
Figure 5
Figure 5
(A) western blot for BRCA2 knock down in HeLa SilenciX cells. (B) Clonogenics survival assay for L82 sensitivity in HeLa control and HeLa (BRCA2_KD) cells (p-value was calculated as an average across control and KD cell line). (C) western blot for ATM knockdown in HeLa SilenciX cells. (D) Clonogenics survival assay for L82 sensitivity in HeLa control and HeLa (ATM_KD) cells (p-value was calculated as an average across control and KD cell line). (E) Quantification of γH2AX positive cells by flow cytometry in HeLa control cells, HeLa (BRCA2_KD) and HeLa (ATM_KD) cells treated with L82 (10µM) for 24 h. (F) Cell cycle analysis by flow cytometry in HeLa control cells, HeLa (BRCA2_KD) and HeLa (ATM_KD) cells treated with L82 (10µM) for 24 h. (G) AnnexinV analysis for apoptotic cells in HeLa control cells, HeLa (BRCA2_KD) and HeLa (ATM_KD) cells treated with L82 (10µM) for 24 h. (H) Representative photomicrographic images of HeLa control, HeLa (BRCA2_KD) & HeLa (ATM_KD) 3D-spheres treated with 10 μM of L82. (I) Quantification of spheroids size by ImageJ software. (J) quantification of spheroids cell viability by flow cytometry. (K) L82 sensitivity in PEO1 and PEO4 cells. Figures are representative of 3 or more experiments. Error bars represent standard error of mean between experiments. '*' = P-values < 0.05, '**' = P-values < 0.01, '***' = P-values < 0.001.

References

    1. Konstantinopoulos PA, Lheureux S, Moore KN. PARP Inhibitors for Ovarian Cancer: Current Indications, Future Combinations, and Novel Assets in Development to Target DNA Damage Repair. Am Soc Clin Oncol Educ Book. 2020;40:1–16. - PubMed
    1. Lord CJ, Ashworth A. PARP inhibitors: Synthetic lethality in the clinic. Science. 2017;355:1152–8. - PMC - PubMed
    1. Lord CJ, Tutt AN, Ashworth A. Synthetic lethality and cancer therapy: lessons learned from the development of PARP inhibitors. Annu Rev Med. 2015;66:455–70. - PubMed
    1. D'Andrea AD. Mechanisms of PARP inhibitor sensitivity and resistance. DNA Repair (Amst) 2018;71:172–6. - PubMed
    1. Francica P, Rottenberg S. Mechanisms of PARP inhibitor resistance in cancer and insights into the DNA damage response. Genome Med. 2018;10:101. - PMC - PubMed

Publication types

MeSH terms