. 2021 Sep;47(9):995-1008.
doi: 10.1007/s00134-021-06495-y. Epub 2021 Aug 9.

Time course of risk factors associated with mortality of 1260 critically ill patients with COVID-19 admitted to 24 Italian intensive care units

Collaborators, Affiliations

Time course of risk factors associated with mortality of 1260 critically ill patients with COVID-19 admitted to 24 Italian intensive care units

Alberto Zanella et al. Intensive Care Med. 2021 Sep.

Abstract

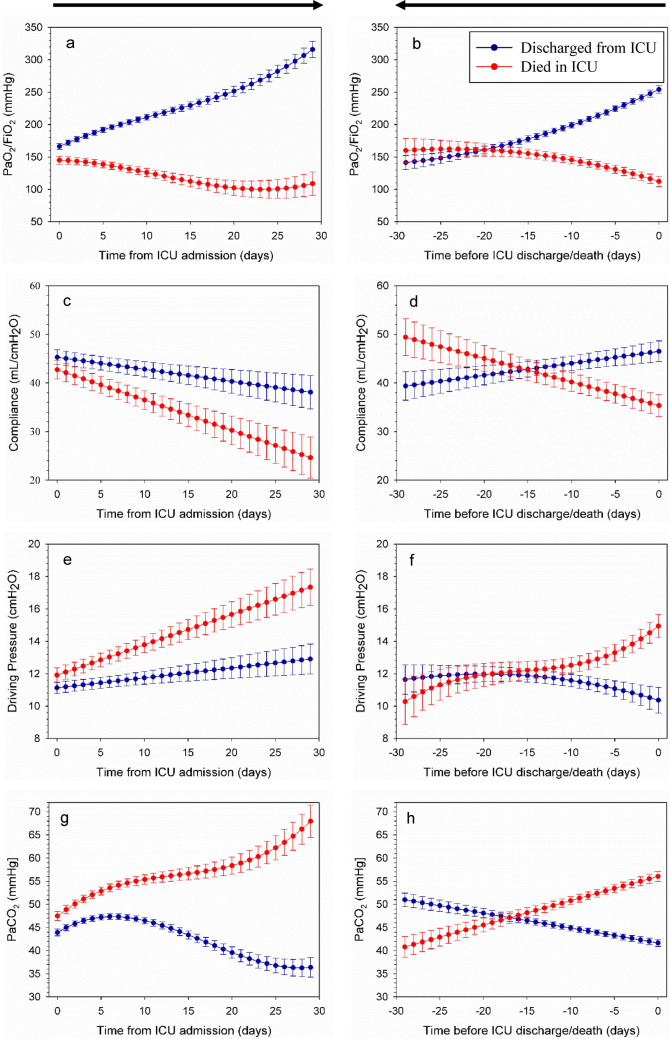
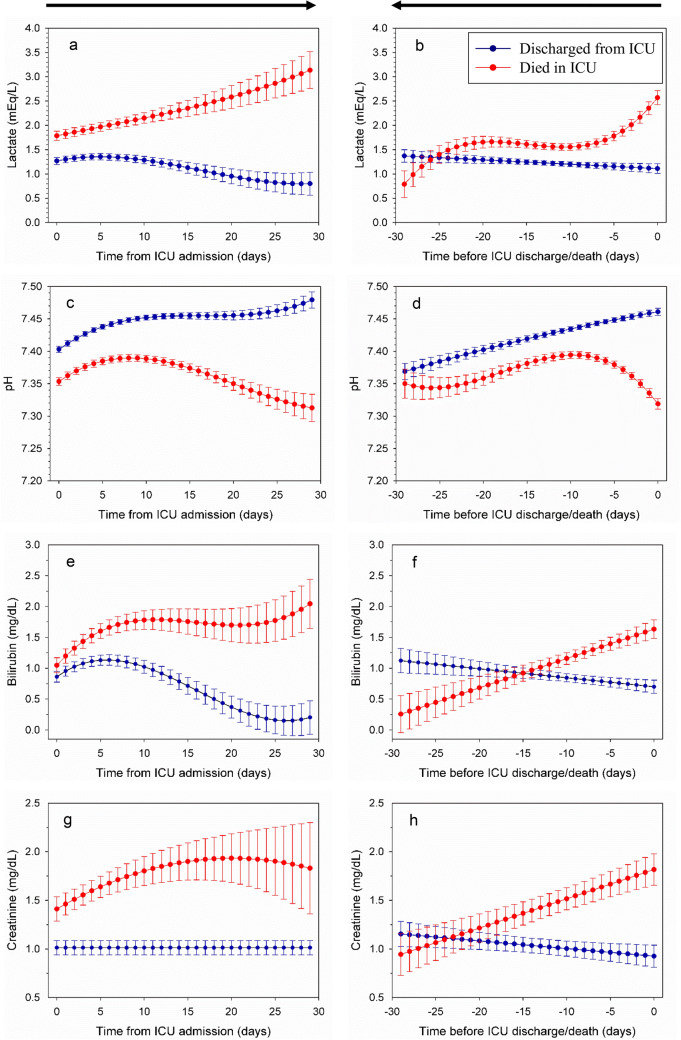
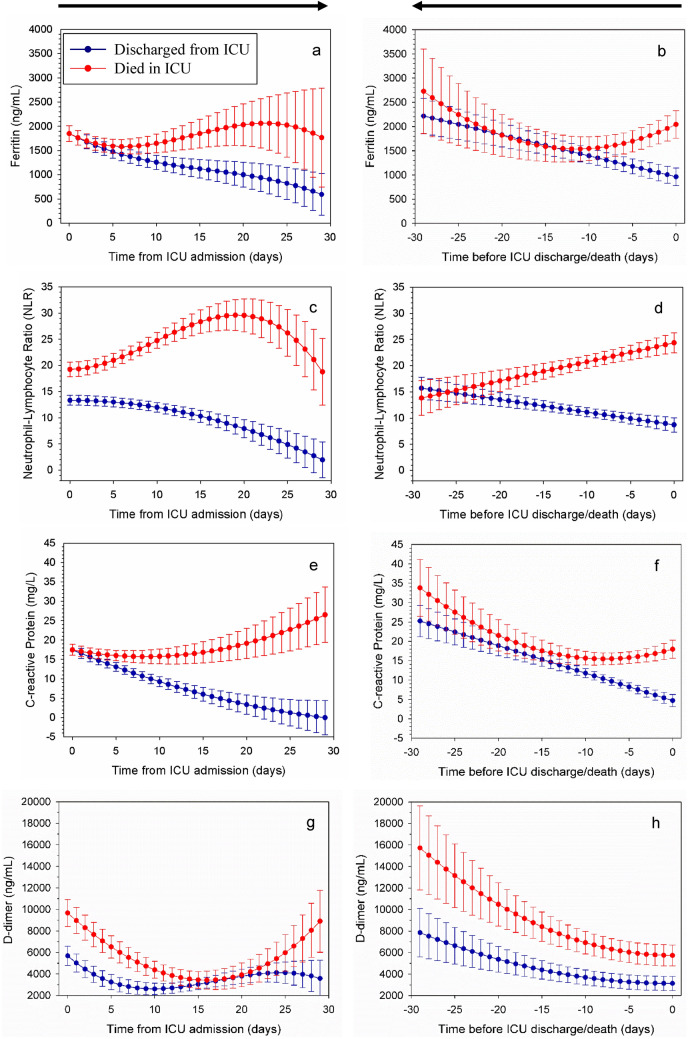
Purpose: To evaluate the daily values and trends over time of relevant clinical, ventilatory and laboratory parameters during the intensive care unit (ICU) stay and their association with outcome in critically ill patients with coronavirus disease 19 (COVID-19).

Methods: In this retrospective-prospective multicentric study, we enrolled COVID-19 patients admitted to Italian ICUs from February 22 to May 31, 2020. Clinical data were daily recorded. The time course of 18 clinical parameters was evaluated by a polynomial maximum likelihood multilevel linear regression model, while a full joint modeling was fit to study the association with ICU outcome.

Results: 1260 consecutive critically ill patients with COVID-19 admitted in 24 ICUs were enrolled. 78% were male with a median age of 63 [55-69] years. At ICU admission, the median ratio of arterial oxygen partial pressure to fractional inspired oxygen (PaO2/FiO2) was 122 [89-175] mmHg. 79% of patients underwent invasive mechanical ventilation. The overall mortality was 34%. Both the daily values and trends of respiratory system compliance, PaO2/FiO2, driving pressure, arterial carbon dioxide partial pressure, creatinine, C-reactive protein, ferritin, neutrophil, neutrophil-lymphocyte ratio, and platelets were associated with survival, while for lactate, pH, bilirubin, lymphocyte, and urea only the daily values were associated with survival. The trends of PaO2/FiO2, respiratory system compliance, driving pressure, creatinine, ferritin, and C-reactive protein showed a higher association with survival compared to the daily values.

Conclusion: Daily values or trends over time of parameters associated with acute organ dysfunction, acid-base derangement, coagulation impairment, or systemic inflammation were associated with patient survival.

Trial registration: ClinicalTrials.gov NCT04388670.

Keywords: COVID-19; Intensive care unit; Longitudinal models; Mortality; Predictors; Time course.


Conflict of interest statement

GG reported personal fees and non-financial support from Getinge and from Biotest, personal fees from ThermoFisher, grants and personal fees from Fisher&Paykel, and personal fees from Draeger Medical outside the submitted work. AP reported personal fees from Maquet, from Novalung/Xenios, from Baxter, and from Boehringer Ingelheim outside the submitted work. The authors certify that they have no affiliations with, or involvement in, any organization or entity with any financial or non-financial interest in the subject matter discussed in this manuscript.

Figures

Fig. 1
Fig. 1
Time course of physiological variables during ICU stay according to the patient's outcome life status at discharge obtained by a polynomial maximum likelihood multilevel model with a random intercept at the patient level and random slope at the time level (see text for description of the model). a and b PaO2/FiO2; c and d respiratory system compliance; e and f driving pressure; g and h PaCO2. Dots represent data from the overall models, error bars represent 95% confidence interval of the model. Blue color represents patients discharged from ICU, while red color represents patients died in ICU. The analysis was performed in two ways: (1) temporal trends were modeled from ICU admission (day 0) up to 30 days or ICU discharge/death (left panels a, c, e, g); (2) the time scale was adjusted by subtracting each patient’s ICU discharge/death time (day 0) back to a maximum of 30 days (right panels b, d, f, h)
Fig. 2
Fig. 2
Time course of physiological variables during ICU stay according to the patient's outcome life status at discharge obtained by a polynomial maximum likelihood multilevel model with a random intercept at the patient level and random slope at the time level (see text for description of the model). a and b Lactate; c and d pH; e and f bilirubin; g and h creatinine. Dots represent data from the overall models, error bars represent 95% confidence interval of the model. Blue color represents patients discharged from ICU while red color represents patients died in ICU. The analysis was performed in two ways: (1) temporal trends were modeled from ICU admission (day 0) up to 30 days or ICU discharge/death (left panels a, c, e, g); (2) the time scale was adjusted by subtracting each patient’s ICU discharge/death time (day 0) back to a maximum of 30 days (right panels b, d, f, h)
Fig. 3
Fig. 3
Time course of physiological variables during ICU stay according to the patient's outcome life status at discharge obtained by a polynomial maximum likelihood multilevel model with a random intercept at the patient level and random slope at the time level (see text for description of the model). a and b Ferritin; c and d neutrophil–lymphocyte ratio; e and f C-reactive protein; g and h D-Dimer. Dots represent data from the overall models, and error bars represent 95% confidence interval of the model. Blue color represents patients discharged from ICU, while red color represents patients died in ICU. The analysis was performed in two ways: (1) temporal trends were modeled from ICU admission (day 0) up to 30 days or ICU discharge/death (left panels a, c, e, g); (2) the time scale was adjusted by subtracting each patient’s ICU discharge/death time (day 0) back to a maximum of 30 days (right panels b, d, f, h)

Similar articles

Cited by

References

    1. Grasselli G, Pesenti A, Cecconi M. Critical care utilization for the COVID-19 outbreak in Lombardy, Italy. JAMA. 2020;323:1545. doi: 10.1001/jama.2020.4031. - DOI - PubMed
    1. Guan W, Ni Z, Hu Y, et al. Clinical characteristics of coronavirus disease 2019 in China. N Engl J Med. 2020;382:1708–1720. doi: 10.1056/NEJMoa2002032. - DOI - PMC - PubMed
    1. Huang C, Wang Y, Li X, et al. Clinical features of patients infected with 2019 novel coronavirus in Wuhan, China. Lancet. 2020;395:497–506. doi: 10.1016/S0140-6736(20)30183-5. - DOI - PMC - PubMed
    1. Grasselli G, Zangrillo A, Zanella A, et al. Baseline characteristics and outcomes of 1591 patients infected with SARS-CoV-2 admitted to ICUs of the Lombardy Region, Italy. JAMA. 2020;323:1574. doi: 10.1001/jama.2020.5394. - DOI - PMC - PubMed
    1. Grasselli G, Greco M, Zanella A, et al. Risk factors associated with mortality among patients with COVID-19 in Intensive Care Units in Lombardy, Italy. JAMA Intern Med. 2020;180:1345–1355. doi: 10.1001/jamainternmed.2020.3539. - DOI - PMC - PubMed

Publication types

Associated data