How to do Better N400 Studies: Reproducibility, Consistency and Adherence to Research Standards in the Existing Literature
- PMID: 34374003
- PMCID: PMC9381463
- DOI: 10.1007/s11065-021-09513-4
How to do Better N400 Studies: Reproducibility, Consistency and Adherence to Research Standards in the Existing Literature
Abstract
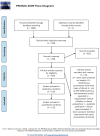
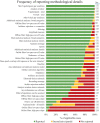
Given the complexity of ERP recording and processing pipeline, the resulting variability of methodological options, and the potential for these decisions to influence study outcomes, it is important to understand how ERP studies are conducted in practice and to what extent researchers are transparent about their data collection and analysis procedures. The review gives an overview of methodology reporting in a sample of 132 ERP papers, published between January 1980 - June 2018 in journals included in two large databases: Web of Science and PubMed. Because ERP methodology partly depends on the study design, we focused on a well-established component (the N400) in the most commonly assessed population (healthy neurotypical adults), in one of its most common modalities (visual images). The review provides insights into 73 properties of study design, data pre-processing, measurement, statistics, visualization of results, and references to supplemental information across studies within the same subfield. For each of the examined methodological decisions, the degree of consistency, clarity of reporting and deviations from the guidelines for best practice were examined. Overall, the results show that each study had a unique approach to ERP data recording, processing and analysis, and that at least some details were missing from all papers. In the review, we highlight the most common reporting omissions and deviations from established recommendations, as well as areas in which there was the least consistency. Additionally, we provide guidance for a priori selection of the N400 measurement window and electrode locations based on the results of previous studies.
Keywords: ERP methodology; Event related potentials; N400; Open science; Pictures; Reproducibility.
© 2021. The Author(s).
Figures


Similar articles
-
Garden of forking paths in ERP research - Effects of varying pre-processing and analysis steps in an N400 experiment.Psychophysiology. 2024 Oct;61(10):e14628. doi: 10.1111/psyp.14628. Epub 2024 Jul 3. Psychophysiology. 2024. PMID: 38961523
-
ERP CORE: An open resource for human event-related potential research.Neuroimage. 2021 Jan 15;225:117465. doi: 10.1016/j.neuroimage.2020.117465. Epub 2020 Oct 21. Neuroimage. 2021. PMID: 33099010 Free PMC article.
-
Variations in ERP data quality across paradigms, participants, and scoring procedures.Psychophysiology. 2023 Jul;60(7):e14264. doi: 10.1111/psyp.14264. Epub 2023 Feb 7. Psychophysiology. 2023. PMID: 36748399 Free PMC article.
-
Psychometric considerations in the measurement of event-related brain potentials: Guidelines for measurement and reporting.Int J Psychophysiol. 2017 Jan;111:57-67. doi: 10.1016/j.ijpsycho.2016.09.005. Epub 2016 Sep 10. Int J Psychophysiol. 2017. PMID: 27619493 Review.
-
Pearls and pitfalls in brain functional analysis by event-related potentials: a narrative review by the Italian Psychophysiology and Cognitive Neuroscience Society on methodological limits and clinical reliability-part I.Neurol Sci. 2020 Oct;41(10):2711-2735. doi: 10.1007/s10072-020-04420-7. Epub 2020 May 9. Neurol Sci. 2020. PMID: 32388645 Review.
Cited by
-
Cognitive effort investment: Does disposition become action?PLoS One. 2023 Aug 22;18(8):e0289428. doi: 10.1371/journal.pone.0289428. eCollection 2023. PLoS One. 2023. PMID: 37607171 Free PMC article.
-
The neurophysiological mechanism of valence-space congruency effect: evidence from spatial Stroop task and event-related EEG features.Cogn Neurodyn. 2023 Aug;17(4):855-867. doi: 10.1007/s11571-022-09842-x. Epub 2022 Aug 24. Cogn Neurodyn. 2023. PMID: 37522040 Free PMC article.
-
Dataset of 37-subject EEG recordings using a low-cost mobile EEG headset during a semantic relatedness judgment task.Data Brief. 2025 Feb 12;59:111390. doi: 10.1016/j.dib.2025.111390. eCollection 2025 Apr. Data Brief. 2025. PMID: 40070410 Free PMC article.
-
Preprocessing choices for P3 analyses with mobile EEG: A systematic literature review and interactive exploration.Psychophysiology. 2025 Jan;62(1):e14743. doi: 10.1111/psyp.14743. Psychophysiology. 2025. PMID: 39697161 Free PMC article.
-
Development of the N400 for Word Learning in the First 2 Years of Life: A Systematic Review.Front Psychol. 2021 Jun 30;12:689534. doi: 10.3389/fpsyg.2021.689534. eCollection 2021. Front Psychol. 2021. PMID: 34276518 Free PMC article.
References
-
- Balconi, M., & Pozzoli, U. (2005). Comprehending semantic and grammatical violations in Italian. N400 and P600 comparison with visual and auditory stimuli. Journal of Psycholinguistic Research, 34(1), 71–98. - PubMed
-
- Balconi, M., & Vitaloni, S. (2014). N400 Effect When a Semantic Anomaly is Detected in Action Representation. A Source Localization Analysis. Journal of Clinical Neurophysiology, 31(1), 58–64. 10.1097/WNP.0000000000000017 - PubMed
Publication types
MeSH terms
LinkOut - more resources
Full Text Sources

