

Multi-parametric MRI (mpMRI) for treatment response assessment of radiation therapy
- PMID: 34374098
- PMCID: PMC9769892
- DOI: 10.1002/mp.15130
Multi-parametric MRI (mpMRI) for treatment response assessment of radiation therapy
Abstract
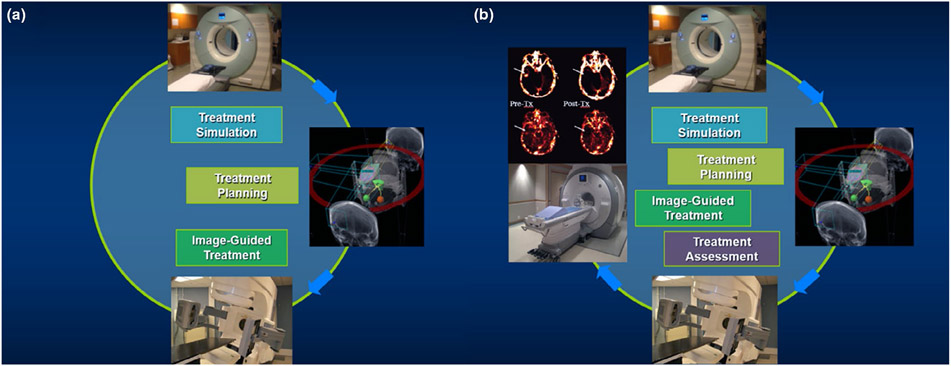
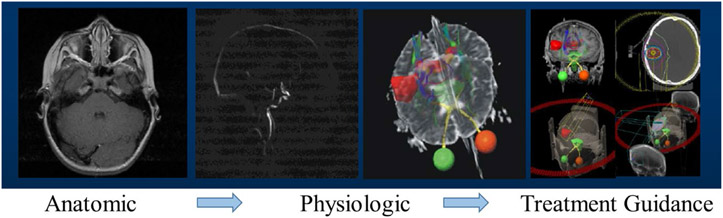
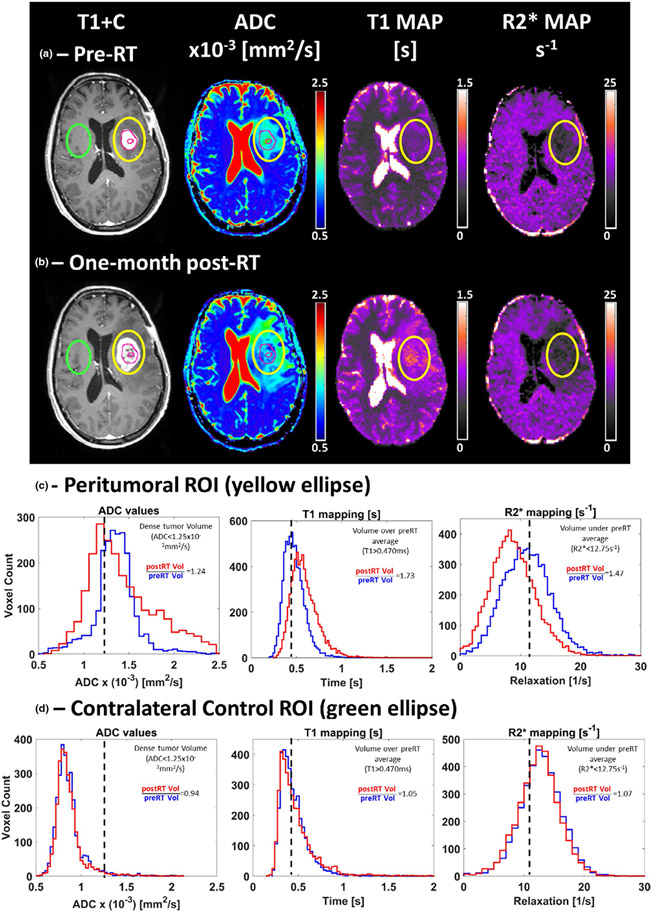
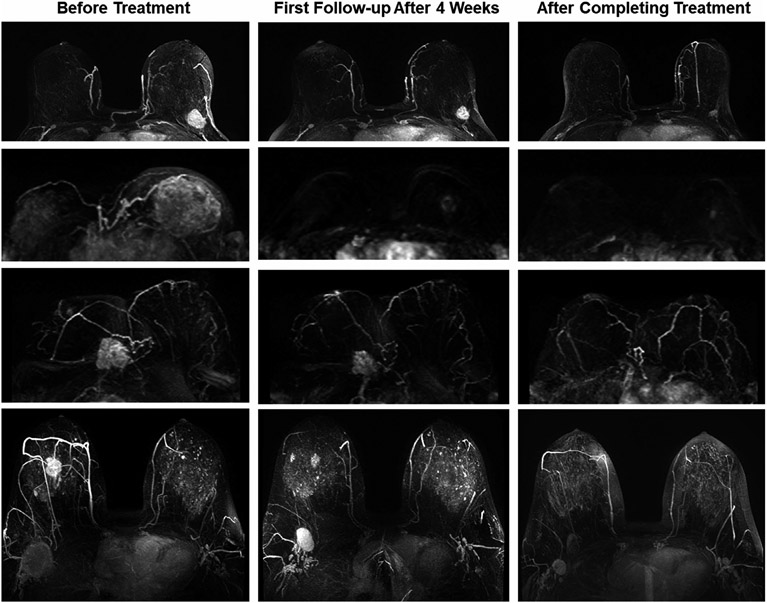
Magnetic resonance imaging (MRI) plays an important role in the modern radiation therapy (RT) workflow. In comparison with computed tomography (CT) imaging, which is the dominant imaging modality in RT, MRI possesses excellent soft-tissue contrast for radiographic evaluation. Based on quantitative models, MRI can be used to assess tissue functional and physiological information. With the developments of scanner design, acquisition strategy, advanced data analysis, and modeling, multiparametric MRI (mpMRI), a combination of morphologic and functional imaging modalities, has been increasingly adopted for disease detection, localization, and characterization. Integration of mpMRI techniques into RT enriches the opportunities to individualize RT. In particular, RT response assessment using mpMRI allows for accurate characterization of both tissue anatomical and biochemical changes to support decision-making in monotherapy of radiation treatment and/or systematic cancer management. In recent years, accumulating evidence have, indeed, demonstrated the potentials of mpMRI in RT response assessment regarding patient stratification, trial benchmarking, early treatment intervention, and outcome modeling. Clinical application of mpMRI for treatment response assessment in routine radiation oncology workflow, however, is more complex than implementing an additional imaging protocol; mpMRI requires additional focus on optimal study design, practice standardization, and unified statistical reporting strategy to realize its full potential in the context of RT. In this article, the mpMRI theories, including image mechanism, protocol design, and data analysis, will be reviewed with a focus on the radiation oncology field. Representative works will be discussed to demonstrate how mpMRI can be used for RT response assessment. Additionally, issues and limits of current works, as well as challenges and potential future research directions, will also be discussed.
Keywords: RT; multiparametric MRI; response assessment.
© 2021 American Association of Physicists in Medicine.
Conflict of interest statement
CONFLICT OF INTEREST
The authors have no conflicts to disclose.
Figures
Similar articles
-
Multiparametric magnetic resonance imaging for radiation therapy response monitoring in soft tissue sarcomas: a histology and MRI co-registration algorithm.Theranostics. 2023 Mar 5;13(5):1594-1606. doi: 10.7150/thno.81938. eCollection 2023. Theranostics. 2023. PMID: 37056570 Free PMC article.
-
Multiparametric Magnetic Resonance Imaging as a Noninvasive Assessment of Tumor Response to Neoadjuvant Pembrolizumab in Muscle-invasive Bladder Cancer: Preliminary Findings from the PURE-01 Study.Eur Urol. 2020 May;77(5):636-643. doi: 10.1016/j.eururo.2019.12.016. Epub 2019 Dec 25. Eur Urol. 2020. PMID: 31882281
-
Diagnostic Accuracy of Single-plane Biparametric and Multiparametric Magnetic Resonance Imaging in Prostate Cancer: A Randomized Noninferiority Trial in Biopsy-naïve Men.Eur Urol Oncol. 2021 Dec;4(6):855-862. doi: 10.1016/j.euo.2021.03.007. Epub 2021 Apr 21. Eur Urol Oncol. 2021. PMID: 33893066 Clinical Trial.
-
Multi-parametric MRI for radiotherapy simulation.Med Phys. 2023 Aug;50(8):5273-5293. doi: 10.1002/mp.16256. Epub 2023 Feb 9. Med Phys. 2023. PMID: 36710376 Free PMC article. Review.
-
Magnetic resonance imaging (MRI)-based radiomics for prostate cancer radiotherapy.Transl Androl Urol. 2018 Jun;7(3):445-458. doi: 10.21037/tau.2018.06.05. Transl Androl Urol. 2018. PMID: 30050803 Free PMC article. Review.
Cited by
-
A neural ordinary differential equation model for visualizing deep neural network behaviors in multi-parametric MRI-based glioma segmentation.Med Phys. 2023 Aug;50(8):4825-4838. doi: 10.1002/mp.16286. Epub 2023 Mar 2. Med Phys. 2023. PMID: 36840621 Free PMC article.
-
Biomarker-driven molecular imaging probes in radiotherapy.Theranostics. 2024 Jul 2;14(10):4127-4146. doi: 10.7150/thno.97768. eCollection 2024. Theranostics. 2024. PMID: 38994026 Free PMC article. Review.
-
Potential of quantitative T1 mapping to serve as a novel prognostic predictor of clear cell renal cell carcinoma after nephrectomy.Quant Imaging Med Surg. 2024 Oct 1;14(10):7600-7611. doi: 10.21037/qims-23-1829. Epub 2024 Sep 26. Quant Imaging Med Surg. 2024. PMID: 39429588 Free PMC article.
-
Inversion-recovery ultrashort-echo-time (IR-UTE) MRI-based detection of radiation dose heterogeneity in gynecologic cancer patients treated with HDR brachytherapy.Radiat Oncol. 2024 Aug 6;19(1):105. doi: 10.1186/s13014-024-02499-2. Radiat Oncol. 2024. PMID: 39107776 Free PMC article.
-
Quantitative magnetic resonance imaging responses in head and neck cancer patients treated with magnetic resonance-guided hypofractionated radiation therapy.Phys Imaging Radiat Oncol. 2025 Jan 2;33:100693. doi: 10.1016/j.phro.2024.100693. eCollection 2025 Jan. Phys Imaging Radiat Oncol. 2025. PMID: 39877149 Free PMC article.
References
-
- Boon IS, Lim JS, Yap MH, Yong TPA, Boon CS. Artificial intelligence and soft skills in radiation oncology: data versus wisdom. J Med Imaging Radiat Sci. 2020;51(4):S114–S115. - PubMed
-
- Delaney G, Jacob S, Featherstone C, Barton M. The role of radiotherapy in cancer treatment: estimating optimal utilization from a review of evidence-based clinical guidelines. Cancer. 2005;104(6):1129–1137. - PubMed
-
- Rezai P, Pisaneschi MJ, Feng C, Yaghmai V. A radiologist's guide to treatment response criteria in oncologic imaging: anatomic imaging biomarkers. Am J Roentgenol. 2013;201(2):237–245. - PubMed
-
- Eisenhauer EA, Therasse P, Bogaerts J, et al. New response evaluation criteria in solid tumours: revised RECIST guideline (version 1.1). Eur J Cancer. 2009;45(2):228–247. - PubMed
