Lamivudine improves cognitive decline in SAMP8 mice: Integrating in vivo pharmacological evaluation and network pharmacology
- PMID: 34374199
- PMCID: PMC8419189
- DOI: 10.1111/jcmm.16811
Lamivudine improves cognitive decline in SAMP8 mice: Integrating in vivo pharmacological evaluation and network pharmacology
Abstract
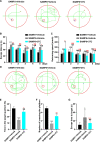
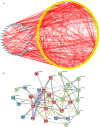
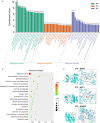
The reverse transcriptase inhibitors such as lamivudine (3TC) play important roles in anti-ageing, but their effects on neurodegenerative diseases caused by ageing are not clear, especially on the functions of the nervous system such as cognition. In this study, we administered 3TC to senescence-accelerated mouse prone 8 (SAMP8) mice by gastric perfusion (100 mg/kg) for 4 weeks. Our results showed that 3TC significantly improved the ageing status of SAMP8 mice, especially the decline of cognitive ability evaluated by the Morris water maze test. To further investigate the molecular mechanisms of improving the ageing status of SAMP8 mice by 3TC, the qPCR and tissue staining methods were used to study the brain tissues (i.e., hippocampus and cortex) of mice, while the network pharmacology analysis was applied to investigate the potential targets of 3TC. The results showed that the mRNA levels of genes related to long interspersed element-1, type 1 interferon response, the senescence-associated secretion phenotype and the Alzheimer's disease in the hippocampus and cortex of SAMP8 mice were increased due to senescence, but this trend was reversed partially by 3TC. Results of histological studies showed that 3TC reduced the death of hippocampal neurons, while the results of network pharmacology analysis indicated that 3TC may exert its influence through multiple pathways, including the oestrogen signalling and the PI3K/Akt and neuroactive ligand-receptor interaction signalling pathways, which we have verified through in vitro experiments. These findings provide evidence for the therapeutic potential of 3TC in the treatment of neurodegenerative diseases.
Keywords: ageing; cognitive ability; lamivudine; long interspersed element-1; neurodegenerative diseases.
© 2021 The Authors. Journal of Cellular and Molecular Medicine published by Foundation for Cellular and Molecular Medicine and John Wiley & Sons Ltd.
Conflict of interest statement
The authors declare that they have no conflict of interest.
Figures


Similar articles
-
Tripchlorolide improves age-associated cognitive deficits by reversing hippocampal synaptic plasticity impairment and NMDA receptor dysfunction in SAMP8 mice.Behav Brain Res. 2014 Jan 1;258:8-18. doi: 10.1016/j.bbr.2013.10.010. Epub 2013 Oct 17. Behav Brain Res. 2014. PMID: 24140565
-
The reverse transcriptase inhibitor 3TC modulates hippocampal transcriptome signatures of inflammation in tauopathy model mice.Exp Gerontol. 2024 Jul;192:112458. doi: 10.1016/j.exger.2024.112458. Epub 2024 May 21. Exp Gerontol. 2024. PMID: 38735597 Free PMC article.
-
Icariin Delays Brain Aging in Senescence-Accelerated Mouse Prone 8 (SAMP8) Model via Inhibiting Autophagy.J Pharmacol Exp Ther. 2019 Apr;369(1):121-128. doi: 10.1124/jpet.118.253310. Epub 2019 Mar 5. J Pharmacol Exp Ther. 2019. PMID: 30837279
-
Perspectives on the molecular mechanism of inhibition and toxicity of nucleoside analogs that target HIV-1 reverse transcriptase.Biochim Biophys Acta. 2002 Jul 18;1587(2-3):296-9. doi: 10.1016/s0925-4439(02)00092-3. Biochim Biophys Acta. 2002. PMID: 12084471 Review.
-
[Effects of melatonin in the brain of the senescence-accelerated mice-prone 8 (SAMP8) model].Rev Neurol. 2011 May 16;52(10):618-22. Rev Neurol. 2011. PMID: 21488009 Review. Spanish.
Cited by
-
Lamivudine (3TC), a Nucleoside Reverse Transcriptase Inhibitor, Prevents the Neuropathological Alterations Present in Mutant Tau Transgenic Mice.Int J Mol Sci. 2023 Jul 6;24(13):11144. doi: 10.3390/ijms241311144. Int J Mol Sci. 2023. PMID: 37446327 Free PMC article.
-
Lamivudine, a reverse transcriptase inhibitor, rescues cognitive deficits in a mouse model of down syndrome.J Cell Mol Med. 2022 Aug;26(15):4210-4215. doi: 10.1111/jcmm.17411. Epub 2022 Jun 28. J Cell Mol Med. 2022. PMID: 35762509 Free PMC article.
-
Novel effects of reverse transcriptase inhibitor supplementation in skeletal muscle of old mice.Physiol Genomics. 2025 May 1;57(5):308-320. doi: 10.1152/physiolgenomics.00115.2024. Epub 2025 Mar 10. Physiol Genomics. 2025. PMID: 40062980 Free PMC article.
-
A case for seeking sex-specific treatments in Alzheimer's disease.Front Aging Neurosci. 2024 Feb 13;16:1346621. doi: 10.3389/fnagi.2024.1346621. eCollection 2024. Front Aging Neurosci. 2024. PMID: 38414633 Free PMC article. Review.
-
Amelioratory Effect of Melatonin on Cognition Dysfunction Induced by Sevoflurane Anesthesia in Aged Mice.Iran J Pharm Res. 2023 Jan 24;21(1):e133971. doi: 10.5812/ijpr-133971. eCollection 2022 Dec. Iran J Pharm Res. 2023. PMID: 36896324 Free PMC article.
References
-
- Delgado‐Lara DL, González‐Enríquez GV, Torres‐Mendoza BM, et al. Effect of melatonin administration on the PER1 and BMAL1 clock genes in patients with Parkinson's disease. Biomed Pharmacother. 2020;129:110485. - PubMed
-
- Agatonovic‐Kustrin S, Kettle C, Morton DW. A molecular approach in drug development for Alzheimer's disease. Biomed Pharmacother. 2018;106:553‐565. - PubMed
Publication types
MeSH terms
Substances
LinkOut - more resources
Full Text Sources
Other Literature Sources
Medical

