

Refined pancreatobiliary UroVysion criteria and an approach for further optimization
- PMID: 34374212
- PMCID: PMC8419786
- DOI: 10.1002/cam4.4043
Refined pancreatobiliary UroVysion criteria and an approach for further optimization
Abstract
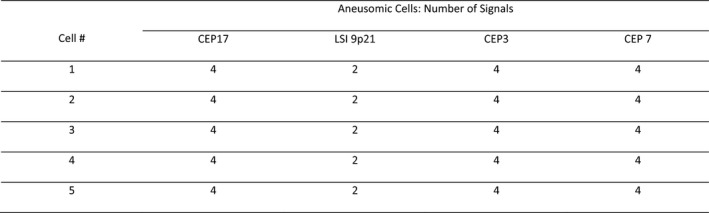
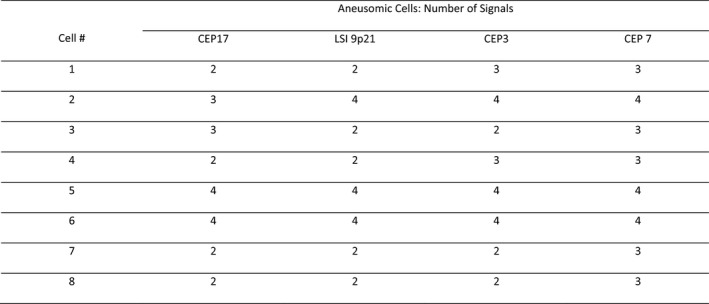
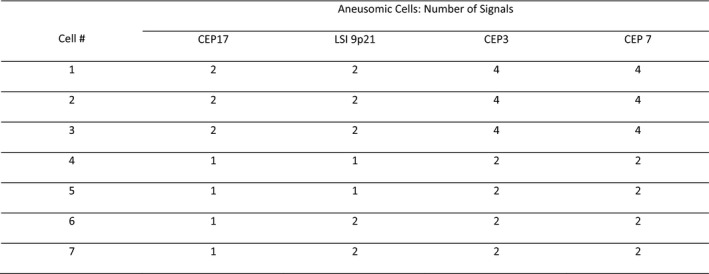
Pancreatobiliary strictures are a common source of false negatives for malignancy detection. UroVysion is more sensitive than any other method but remains underutilized because of conflicting sensitivities and specificities due to a lack of standardized cutoff criteria and confusion in interpreting results in the context of primary sclerosing cholangitis. We set out to determine the sensitivities and specificities of UroVysion, brushing cytology, forceps biopsies, and fine needle aspiration (FNAs) for pancreatobiliary stricture malignancy detection. A retrospective review was performed of all biopsied pancreatobiliary strictures at our institution over 5 years. UroVysion was unquestionably the most sensitive method and all methods were highly specific. Sensitivity was highest while maintaining specificity when a malignant interpretation was limited to cases with 5+ cells with the same polysomic signal pattern and/or loss of one or both 9p21 signals. Only UroVysion detected the metastases and a neuroendocrine tumor. In reviewing and analyzing the signal patterns, we noticed trends according to location and diagnosis. Herein we describe our method for analyzing signal patterns and propose cutoff criteria based upon observations gleaned from such analysis.
Keywords: FISH; cytogenetics; cytopathology; pancreatobiliary; stricture.
© 2021 The Authors. Cancer Medicine published by John Wiley & Sons Ltd.
Conflict of interest statement
None of the authors have any conflicts of interest to report.
Figures

Similar articles
-
An Optimized Set of Fluorescence In Situ Hybridization Probes for Detection of Pancreatobiliary Tract Cancer in Cytology Brush Samples.Gastroenterology. 2015 Dec;149(7):1813-1824.e1. doi: 10.1053/j.gastro.2015.08.046. Epub 2015 Aug 29. Gastroenterology. 2015. PMID: 26327129
-
UroVysion Multi-Target Fluorescence in situ Hybridization Assay for the Detection of Malignant Bile Duct Brushing Specimens: A Comparison with Routine Cytology.Acta Cytol. 2018;62(4):295-301. doi: 10.1159/000488636. Epub 2018 May 7. Acta Cytol. 2018. PMID: 29734171
-
Improving the accuracy of pancreatobiliary tract cytology with fluorescence in situ hybridization: a molecular test with proven clinical success.Cancer Cytopathol. 2013 Nov;121(11):610-9. doi: 10.1002/cncy.21303. Epub 2013 Apr 30. Cancer Cytopathol. 2013. PMID: 23633236 Review.
-
Routine brush cytology and fluorescence in situ hybridization for assessment of pancreatobiliary strictures.Gastrointest Endosc. 2012 Jan;75(1):65-73. doi: 10.1016/j.gie.2011.08.040. Epub 2011 Nov 10. Gastrointest Endosc. 2012. PMID: 22078103 Clinical Trial.
-
FISHing for pancreatobiliary tract malignancy in endoscopic brushings enhances the sensitivity of routine cytology.Cytopathology. 2014 Oct;25(5):288-301. doi: 10.1111/cyt.12170. Epub 2014 Jul 30. Cytopathology. 2014. PMID: 25073411 Review.
Cited by
-
Mutational Landscape and Precision Medicine in Hepatocellular Carcinoma.Cancers (Basel). 2023 Aug 23;15(17):4221. doi: 10.3390/cancers15174221. Cancers (Basel). 2023. PMID: 37686496 Free PMC article. Review.
-
Morpho-molecular approach (NGS plus digital PCR) in diagnosis of malignant biliary strictures.Pathologica. 2025 Feb;117(1):10-17. doi: 10.32074/1591-951X-1117. Pathologica. 2025. PMID: 40205926 Free PMC article.
-
Applications of Exosomes in Diagnosing Muscle Invasive Bladder Cancer.Pharmaceutics. 2022 Sep 23;14(10):2027. doi: 10.3390/pharmaceutics14102027. Pharmaceutics. 2022. PMID: 36297462 Free PMC article. Review.
-
Diagnostic Accuracy Performance of Fluorescence In Situ Hybridization (FISH) for Biliary Strictures: A Systematic Review and Meta-Analysis.J Clin Med. 2024 Oct 28;13(21):6457. doi: 10.3390/jcm13216457. J Clin Med. 2024. PMID: 39518600 Free PMC article. Review.
References
-
- Martinez NS, Trindade AJ, Sejpal DV. Determining the indeterminate biliary stricture: cholangioscopy and beyond. Curr Gastroenterol Rep. 2020;22(12):58. - PubMed
-
- Adler DG, Witt B. Cytologic diagnosis of biliary strictures: fish or cut the sensitivity rate? Dig Dis Sci. 2018;63(3):549‐550. - PubMed
-
- Kipp BR, Stadheim LM, Halling SA, et al. A comparison of routine cytology and fluorescence in situ hybridization for the detection of malignant bile duct strictures. Am J Gastroenterol. 2004;99(9):1675‐1681. - PubMed
-
- Levy MJ, Clain JE, Clayton A, et al. Preliminary experience comparing routine cytology results with the composite results of digital image analysis and fluorescence in situ hybridization in patients undergoing EUS‐guided FNA. Gastrointest Endosc. 2007;66(3):483‐490. - PubMed
MeSH terms
LinkOut - more resources
Full Text Sources
Medical
