. 2021 Aug 1;134(15):jcs240135.
doi: 10.1242/jcs.240135. Epub 2021 Aug 10.

Tumour cell CD99 regulates transendothelial migration via CDC42 and actin remodelling

Affiliations

Tumour cell CD99 regulates transendothelial migration via CDC42 and actin remodelling

Aarren J Mannion et al. J Cell Sci. .

Abstract

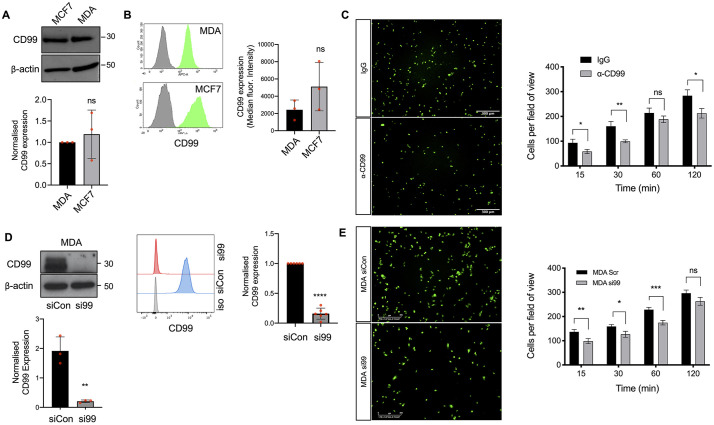
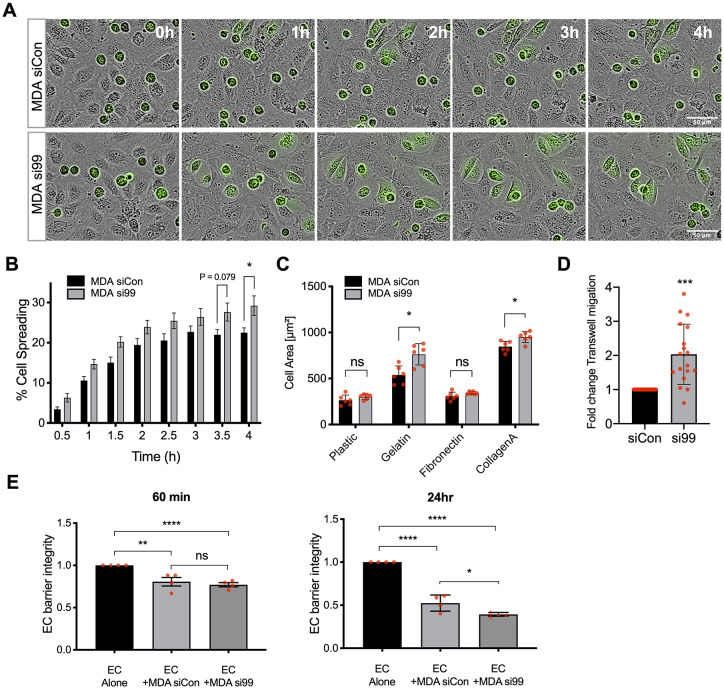
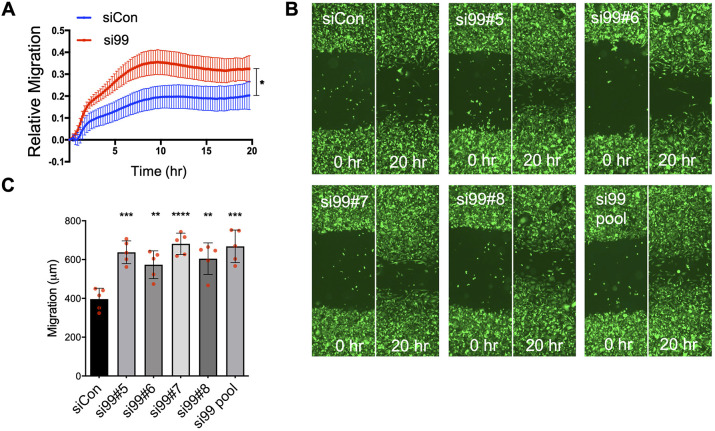
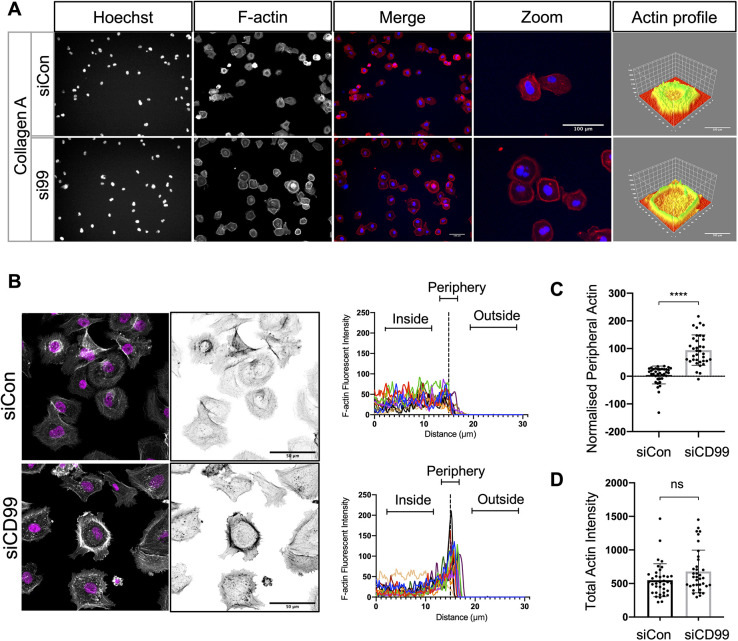
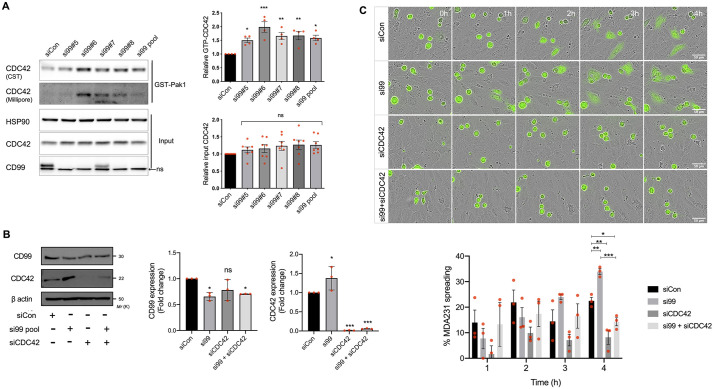
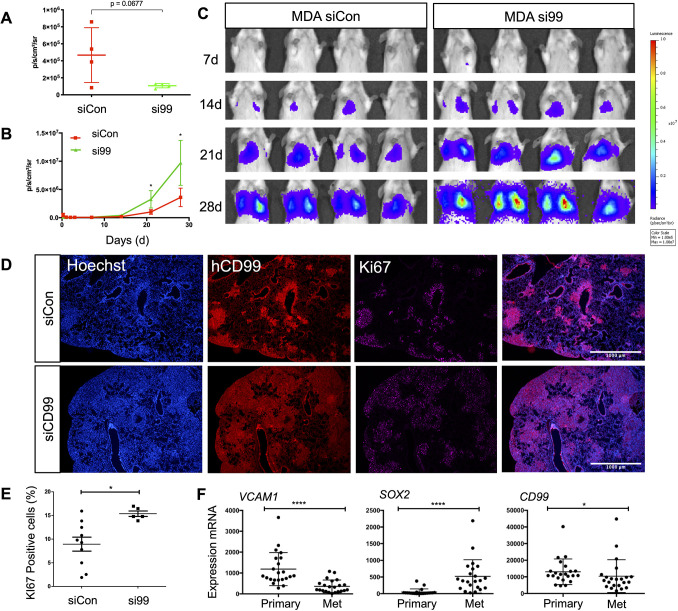
Metastasis requires tumour cells to cross endothelial cell (EC) barriers using pathways similar to those used by leucocytes during inflammation. Cell surface CD99 is expressed by healthy leucocytes and ECs, and participates in inflammatory transendothelial migration (TEM). Tumour cells also express CD99, and we have analysed its role in tumour progression and cancer cell TEM. Tumour cell CD99 was required for adhesion to ECs but inhibited invasion of the endothelial barrier and migratory activity. Furthermore, CD99 depletion in tumour cells caused redistribution of the actin cytoskeleton and increased activity of the Rho GTPase CDC42, known for its role in actin remodelling and cell migration. In a xenograft model of breast cancer, tumour cell CD99 expression inhibited metastatic progression, and patient samples showed reduced expression of the CD99 gene in brain metastases compared to matched primary breast tumours. We conclude that CD99 negatively regulates CDC42 and cell migration. However, CD99 has both pro- and anti-tumour activity, and our data suggest that this results in part from its functional linkage to CDC42 and the diverse signalling pathways downstream of this Rho GTPase. This article has an associated First Person interview with the first author of the paper.

Keywords: Actin cytoskeleton; Breast cancer; CD99; CDC42; Metastasis; Transendothelial migration.


Conflict of interest statement

Competing interests The authors declare no competing or financial interests.

Figures

Fig. 1.
Fig. 1.
CD99 regulates breast cancer adhesion to endothelial cells. (A) Expression of total CD99 protein expression determined by western blotting in breast cancer cell lines MCF7 and MDA-MB-231 (MDA) using anti-CD99 antibody and anti-β actin as a loading control. The graph shows quantification of CD99 protein expression in MCF7 and MDA-MB-231 normalised to the β actin loading control. n=3 independent experiments. (B) Expression of cell surface CD99 on MCF7 and MDA-MB-231 determined by flow cytometry (in green) compared to the isotype control (grey); the graph shows quantification normalised to isotype controls. n=3 independent experiments. (C) Representative images and quantification of the adhesion of Cell Tracker Green (CTG)-labelled MDA-MB-231 cells adhering to confluent HUVEC monolayers pre-treated with anti-CD99 blocking antibody (1 μg/ml) or an IgG control (shown at the 30-min time point). Unbound cells were washed away with PBS before fixation in 4% PFA and quantification of bound cells. n=3 independent experiments. (D) MDA-MB-231 cells were transiently transfected with siRNA targeting CD99 (si99) or a control siRNA (siCon), and CD99 expression was determined using western blotting and flow cytometry 72-96 h post-transfection. For the blot, the graph shows CD99 expression relative to the β actin loading control in the presence of the siRNA molecules. For the flow cytometry, quantification was performed by comparing CD99 expression in the siCon-treated cells compared to si99-treated cells. n=3 independent experiments and n=6 independent experiments for western blots and flow cytometry, respectively. (E) MDA-MB-231 cells were transfected as in D for 72 h before CTG labelling and left to adhere to confluent HUVEC monolayers for indicated time points. Unbound cells were washed away with PBS before fixation, imaging and quantification of bound MDA cells using ImageJ (the images show the 60-min time points). n=3 independent experiments. Data are mean±s.d. (A,B) or s.e.m. (C-E). *P<0.05; **P<0.005; ***P<0.0005; ns, not significant [unpaired two-tailed Student's t-test (with multiple comparisons in C)].
Fig. 2.
Fig. 2.
Breast cancer migration and invasion is regulated by CD99. (A) MDA-MB-231 TEM and intercalation determined by live cell imaging. Control (siCon) or CD99 (si99) siRNA-treated MDA-MB-231 cells were CTG labelled and seeded onto HUVEC monolayers, and intercalation/spreading was captured using live cell imaging. Images were taken every 5 min for 4 h using a 20× objective. (B) Quantification of data in panel A, indicating the percentage of MDA-MB-231 cells that have undergone spreading/intercalation as a percentage of total cells. n=3 independent experiments. (C) Cell area of CD99 siRNA-transfected MDA-MB-231 cells bound to indicated ECM components for 30 min was determined using Columbus image analysis software. Data were collected from multiple cells from two images from n=3 independent experiments. (D) Quantification of TEM of CD99 siRNA-treated MDA-MB-231 cells determined using the modified Boyden transwell insert (3 µm pore size). HUVEC cells were seeded to the upper chamber of transwell inserts for 24 h before CTG-labelled siRNA-treated MDA-MB-231 cells were seeded on top of EC monolayers for 18 h before fixation and imaging following transmigration. We used two transwells per condition and analysed three images per transwell per independent experiment using ImageJ. n=3 independent experiments. (E) MDA-MB-231 cells treated with control or CD99 siRNA were seeded onto confluent HUVEC monolayers and changes in impedance were recorded for 24 h at 37°C under 5% CO2. Data are presented as fold change in barrier integrity compared to HUVEC monolayers alone at indicated time points. n=4 independent experiments. Data are mean±s.e.m. (B,D,E) or s.d. (C). Statistical significance was determined using an unpaired t-test with multiple comparisons (B-D) or one-way ANOVA with Tukey's multiple comparison (E) (*P<0.05; **P<0.005; ***P<0.0005; ****P<0.0001; ns, not significant).
Fig. 3.
Fig. 3.
CD99 suppresses breast cancer migration in vitro. (A) Real-time migration of CD99 siRNA-treated MDA-MB-231 cells determined using the modified Boyden chamber CIM plates and xCelligence RTCA. Changes in impedance are indicative of the number of cells that have migrated. Impedance was measured every 15 min for 24 h. n=4 independent experiments. (B) Representative images of scratch wound migration assay. MDA-MB-231-GFP cells were treated with the indicated individual CD99 siRNA duplexes, pooled CD99 siRNA or control siRNA for 72 h and seeded at equal density into 96-well plates until confluent. Cells were serum starved for 2-3 h before ‘wounding’ using a Wound Maker tool (Essen Bioscience). Migration of siRNA-treated MDA-MB-231 cells was imaged at 0 and 20 h and quantified using ImageJ. (C) Quantification of B, from n=5 independent replicates. Data are mean±s.e.m. *P<0.05, **P<0.005, ***P<0.0005, ****P<0.0001 [analysis of covariance (A) and one-way ANOVA with Tukey's multiple comparison (C)].
Fig. 4.
Fig. 4.
Breast cancer actin dynamics are modulated by CD99 depletion. (A) Control or CD99 siRNA-treated MDA-MB-231 cells (48 h post transfection) were re-plated to collagen type 1 coated plates and allowed to adhere for 30 min. Cells were then stained with Texas Red phalloidin (for F-actin) before imaging using an Operetta HTS imager. Three-dimensional actin distribution plots were generated using ImageJ ‘3D surface plot’ analysis. Images are representative of n=3 independent experiments. (B) As in panel A, siRNA-treated cells were imaged using a LSM 700 confocal microscope, and actin intensity was analysed using ImageJ. Trace plots indicate actin intensity inside the cell, at the cell periphery and outside the cell (as indicated) overlayed for 12 individual cells (four cells each from three random fields of view) from one experiment. Data from two additional experiments are shown in Fig. S4. (C) Quantification of B, where values of actin intensity at the cell periphery were normalised to the cytoplasmic actin of 36 cells from n=3 independent experiments. (D) Quantification of total actin intensity of control or CD99 siRNA-treated MDA-MB-231 cells shown in B and C. Values of total actin intensity of 36 cells from n=3 independent experiments. ****P<0.00005; ns, not significant (unpaired two-tailed t-test).
Fig. 5.
Fig. 5.
Breast cancer TEM is negatively regulated by CD99 through suppression of CDC42 activity. (A) MDA-MB-231 cells were transfected with control, pooled or indicated individual CD99 siRNA molecules for 72 h, and lysates were subject to immunoprecipitation with PAK1-PDB beads and subsequent electrophoresis and blotting to determine GTP-bound CDC42. Precipitated GTP-bound CDC42 was analysed using two different antibodies as indicated. Input control lysates, which had not been subjected to immunoprecipitation with PAK1-PDB beads were electrophoresed alongside pulldown samples to determine total CDC42 protein expression. A non-specific band was present in the CD99 immunoblots (nsb). The graphs (right) show quantification (determined using ImageJ) of active GTP-bound CDC42 and total CDC42; the former was normalised to total CDC42 and the latter to HSP90. n=4 independent experiments for active CDC42 and n=7 for total CDC42. (B) siRNA-mediated knockdown of CD99, CDC42 and co-depletion of CD99 and CDC42 72 h post transfection was determined by western blotting using anti-CD99, anti-CDC42 and anti-β actin antibodies as shown. Quantification (right) shows expression of CD99 and CDC42 normalised to β-actin loading control relative to control siRNA-treated cells. n=3 independent experiments. (C) MDA-MB-231 TEM and intercalation determined by live cell imaging. Control, CD99, CDC42 or CD99 and CDC42 siRNA-treated MDA-MB-231 cells were CTG-labelled and seeded onto HUVEC monolayers, and intercalation/spreading was captured using live cell imaging. Images were taken every 5 min for 4 h using a 20× objective. The graph (right) shows the quantification of data in C, indicating the percentage of MDA-MB-231 cells that have undergone spreading/intercalation as a percentage of total cells. n=3 independent experiments. Data are mean±s.d. (A,B) or s.e.m. (C). Statistical significance was determined using one-way ANOVA and Dunnett's multiple comparison test (A), one-way ANOVA (B) and one-way ANOVA with Tukey's multiple comparison test (C). *P<0.05; **P<0.005; ***P<0.0005; ns, not significant.
Fig. 6.
Fig. 6.
CD99 suppresses the metastatic phenotype of breast cancer in vivo. Luciferase expressing MDA-MB-231 cells were transfected with control or CD99 siRNA and 72 h later, 5×10⁵ cells/mouse were injected into the main tail vein of female CB17-SCID mice (aged 6-8 weeks). (A) Quantification of bioluminescent imaging from 6 h post tail vein injection. n=4 mice per group. (B) Quantification of bioluminescent imaging from each time point over the course of 28 days. n=4 mice per group. (C) For imaging, D-luciferin substrate was injected, and anaesthetised mice from each group were scanned using an IVIS at the indicated times. Images from additional time points are shown in Fig. S5. (D) Representative images of lung tissue from mice injected with control or CD99 siRNA-treated MDA-MB-231 cells. Lungs were isolated 4 weeks post injection and analysed by staining with Hoechst (to detect all cells), anti-human CD99 antibody (to detect the human tumour cells) and anti-Ki67 antibody (to detect proliferating cells). Merged images are also shown. Scale bars: 1000 µm. (E) Quantification (using ImageJ) of Ki67 staining as a percentage of total Hoechst nuclei. (F) Gene expression in primary and matched brain tumour metastases from 22 breast cancer patients (Varešlija et al., 2019). Data for VCAM1, SOX2 and CD99 gene expression in the primary and metastatic (Met) samples were analysed using a Wilcoxon matched pairs signed rank test (*P<0.05, ****P<0.00005). Data are mean±s.d. In A and B, statistical significance was determined using an unpaired two-tailed Student's t-test.

Similar articles

Cited by

References

    1. Ahmed, I., Calle, Y., Iwashita, S. and Nur-E-Kamal, A. (2006). Role of Cdc42 in neurite outgrowth of PC12 cells and cerebellar granule neurons. Mol. Cell. Biochem. 281, 17-25. 10.1007/s11010-006-0165-9 - DOI - PubMed
    1. Al Absi, A., Wurzer, H., Guerin, C., Hoffmann, C., Moreau, F., Mao, X., Brown-Clay, J., Petrolli, R., Casellas, C. P., Dieterle, M.et al. (2018). Actin cytoskeleton remodeling drives breast cancer cell escape from natural killer-mediated cytotoxicity. Cancer Res. 78, 5631-5643. 10.1158/0008-5472.CAN-18-0441 - DOI - PubMed
    1. Benard, V., Bohl, B. P. and Bokoch, G. M. (1999). Characterization of Rac and Cdc42 activation in chemoattractant-stimulated human neutrophils using a novel assay for active GTPases. J. Biol. Chem. 274, 13198-13204. 10.1074/jbc.274.19.13198 - DOI - PubMed
    1. Berish, R. B., Ali, A. N., Telmer, P. G., Ronald, J. A. and Leong, H. S. (2018). Translational models of prostate cancer bone metastasis. Nat. Rev. Urol. 15, 403-421. 10.1038/s41585-018-0020-2 - DOI - PubMed
    1. Bos, P. D., Zhang, X. H.-F., Nadal, C., Shu, W., Gomis, R. R., Nguyen, D. X., Minn, A. J., Van De Vijver, M. J., Gerald, W. L., Foekens, J. A.et al. (2009). Genes that mediate breast cancer metastasis to the brain. Nature 459, 1005-1009. 10.1038/nature08021 - DOI - PMC - PubMed

Publication types

MeSH terms