. 2021 Nov;99(11):3084-3100.
doi: 10.1002/jnr.24931. Epub 2021 Aug 10.

Laterodorsal tegmentum-ventral tegmental area projections encode positive reinforcement signals

Affiliations

Laterodorsal tegmentum-ventral tegmental area projections encode positive reinforcement signals

Bárbara Coimbra et al. J Neurosci Res. 2021 Nov.

Abstract

The laterodorsal tegmentum (LDT) is a brainstem nucleus classically involved in REM sleep and attention, and that has recently been associated with reward-related behaviors, as it controls the activity of ventral tegmental area (VTA) dopaminergic neurons, modulating dopamine release in the nucleus accumbens. To further understand the role of LDT-VTA inputs in reinforcement, we optogenetically manipulated these inputs during different behavioral paradigms in male rats. We found that in a two-choice instrumental task, optical activation of LDT-VTA projections shifts and amplifies preference to the laser-paired reward in comparison to an otherwise equal reward; the opposite was observed with inhibition experiments. In a progressive ratio task, LDT-VTA activation boosts motivation, that is, enhances the willingness to work to get the reward associated with LDT-VTA stimulation; and the reverse occurs when inhibiting these inputs. Animals abolished preference if the reward was omitted, suggesting that LDT-VTA stimulation adds/decreases value to the stimulation-paired reward. In addition, we show that LDT-VTA optical activation induces robust preference in the conditioned and real-time place preference tests, while optical inhibition induces aversion. The behavioral findings are supported by electrophysiological recordings and c-fos immunofluorescence correlates in downstream target regions. In LDT-VTA ChR2 animals, we observed an increase in the recruitment of lateral VTA dopamine neurons and D1 neurons from nucleus accumbens core and shell; whereas in LDT-VTA NpHR animals, D2 neurons appear to be preferentially recruited. Collectively, these data show that the LDT-VTA inputs encode positive reinforcement signals and are important for different dimensions of reward-related behaviors.

Keywords: LDT; motivation; neuronal circuits; optogenetics; reward.


Conflict of interest statement

The authors declare no conflict of interest.

Figures
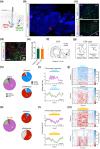
FIGURE 1
FIGURE 1
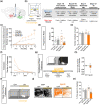
Optogenetic modulation of LDT–VTA projections alters VTA neuronal activity. (a) Strategy used for LDT–VTA projection optogenetic stimulation and electrophysiological recordings in the VTA. (b) Representative immunofluorescence showing eYFP (green) expression in the LDT and mCherry (red) in the VTA; scale bar = 1 mm. (c) Representative immunofluorescence showing YFP staining in the LDT and in terminals in the VTA; scale bar = 100 μm. (d) Representative immunofluorescence showing YFP and NeuN staining in the LDT; scale bar = 100 μm. NeuN immunoreactivity identifies all cells in the LDT. (e) Summary graph showing the proportion of LDT cells (identified by NeuN‐red) that express either opsin, ChR2 or NpHR (identified by GFP‐green). ChR2 (n = 5) and NpHR (n = 5) animals. (f) Electrode placement for cell recording in the VTA for ChR2 (n = 9) and NpHR (n = 5) animals. (g) VTA neurons were separated into putative dopaminergic cells (pDAergic) and putative GABAergic cells (pGABAergic). (h) Majority of recorded cell in the ChR2 group are dopaminergic neurons. The majority of dopaminergic cells neurons significantly increase firing rate, whereas the opposite is observed in GABAergic cells, in response to optical stimulation (80 pulses of 10 ms at 20 Hz) of LDT terminals (n = 89 neurons/9 rats). (i) Temporal activity (0.5 s bins) of VTA pDAergic (upper panel) and pGABAergic (bottom panel) cells in response to LDT optical stimulation. Full line trace represents mean frequency of recorded cells and SEM as error is represented as shading. (j) Heatmap representation of percentages of pDAergic (upper panel) and pGABAergic (bottom panel) cell responses in the VTA upon activation of LDT terminals. (k) The majority of recorded cell in the NpHR group is dopaminergic neurons. Most of pDAergic and pGABAergic cells neurons significantly decrease firing rate, in response to optical inhibition (4 s of continuous yellow laser) of LDT terminals (n = 34 neurons/5 rats). (l) Temporal activity (0.5 s bins) of VTA pDAergic (upper panel) and pGABAergic (bottom panel) cells in response to LDT terminal inhibition. Full line trace represents mean of recorded cells and SEM as error is represented in the shading. (m) Heatmap representation of percentages of pDAergic (upper panel) and pGABAergic (bottom panel) cell responses in the VTA upon inhibition of LDT terminals. Bars represent mean and error bars denote SEM. *p < 0.05
FIGURE 2
FIGURE 2
Optogenetic activation of LDT terminals in the VTA increases motivation. (a) Strategy used for LDT–VTA projection optogenetic stimulation during behavior. (b) Schematic representation of the two‐choice task. Pressing stim− lever yields one food pellet and pressing stim+ lever delivers one pellet + optical stimulation of LDT–VTA inputs (80 10 ms pulses at 20 Hz). (c) Time‐course representation of the responses in ChR2 (n = 11) and YFP (n = 10) rats. Optogenetic activation of LDT–VTA terminals focuses responses for the lever associated with the laser‐paired reward (stim+) over an otherwise equivalent food reward (stim−) in ChR2 animals, but not in control YFP group. (d) Rats were subjected to two PR sessions, one for each lever: in one session, animals are tested for the stim+ lever, and in the other session animals are tested for the stim− lever. We observe an increase in the breakpoint for stim+ lever in ChR2 animals, indicative of enhanced motivation. (e) Total number of rewards earned during progressive ratio of ChR2 and YFP rats. ChR2 animals worked to earn more rewards for the stim+ than the stim− lever or YFP animals. (f) In pellet extinction conditions, both groups decrease responses for both levers. (g) CPP and (i) RTPP paradigms, in which one chamber is associated with laser stimulation (ON side). (h) Difference of total time spent in the OFF and ON sides in YFP (n = 10) and ChR2 (n = 14) groups. (j) Representative tracks for a ChR2 and a YFP animal during the RTPP. (k) Percentage of time spent on the ON and OFF sides, showing preference for the side associated with stimulation. Error bars denote SEM. *p < 0.05; **p < 0.01; ***p < 0.001 (in green significance for comparison within ChR2 group and in black for comparison between ChR2 and YFP)
FIGURE 3
FIGURE 3
Optogenetic inhibition of LDT terminals in the VTA decreases motivation. (a) Strategy used for LDT–VTA projection optogenetic inhibition during behavior. (b) Schematic representation of the two‐choice task. Pressing stim− lever yields one food pellet and pressing stim+ lever delivers one pellet + optical inhibition of LDT–VTA inputs (4 s of constant yellow laser at 10 mW). (c) Time‐course representation of the responses in NpHR (n = 11) and YFP (n = 10) rats. Optogenetic inhibition of LDT–VTA terminals shifts preference for the non‐stimulated lever (stim−) in NpHR animals, but no preference is observed in YFP group. (d) Decrease in breakpoint for stim+ lever in NpHR animals. (e) Total number of rewards earned during progressive ratio of NpHR and YFP rats. NpHR worked less to earn rewards for the stim+ lever. (f) In pellet extinction conditions, both groups decrease responses for both levers. (g) CPP and (i) RTPP paradigms, in which one chamber is associated with laser stimulation (ON side). (h) Difference of total time spent in the OFF and ON sides in YFP (n = 10) and NpHR (n = 14) groups. (j) Representative tracks for a NpHR and a YFP animal during the RTPP. (k) Percentage of time spent on the ON and OFF sides, showing preference for the side associated with no stimulation. Error bars denote SEM. *p < 0.05; **p < 0.01; ***p < 0.001 (in orange significance for comparison within NpHR group and in black for comparison between NpHR and YFP)
FIGURE 4
FIGURE 4
Recruitment of neurons in the LDT, VTA, and NAc after optical modulation of LDT–VTA terminals. (a) Representation of LDT visualized at bregma = −8.5 AP, scale bar = 250 μm. (b) Immunofluorescence of the LDT with staining for cell nuclei (DAPI, blue), ChAT (red), and c‐fos (green), scale bar = 100 μm, inset of positive cell. (c) Density of c‐fos and ChAT double positive cells in ChR2 and YFP rats or (d) NpHR and YFP after PR performance on the stim+ or stim− lever. (e) Representation of medial and lateral VTA subregions visualized at bregma = −5.2 AP, scale bar = 100 μm. (f) Immunofluorescence of the VTA, staining for cell nuclei (DAPI, blue), tyrosine hydroxylase (TH, red), and c‐fos (green), scale bar = 100 μm, inset of positive cell. (g) Density of c‐fos and TH double positive cells in ChR2 and YFP rats or (h) NpHR and YFP after PR performance on the stim+ or stim− lever. There is an increase in the number of c‐fos+/TH+ cells in the lateral VTA after LDT–VTA optical activation, whereas optical inhibition shows no significant differences in the number of recruited cells when compared to YFP animals. (i) Representation of NAc core and shell subregions. (j) Immunofluorescence of the NAc, staining for cell nuclei (DAPI, blue), c‐fos (green) and D1R (red), (k) DR2 (red) or (l) ChAT (red), scale bar = 100 μm. Inset of positive cells in each staining. (m) Density of c‐fos and D1R, DR2 or ChAT double positive cells in ChR2 and YFP rats or (n) NpHR and YFP rats after PR performance on the stim+ or stim− lever. There is an increase in the number of c‐fos+/D1R+ cells in both NAc core and shell subregions after LDT–VTA optical activation, whereas optical inhibition appears to recruit mostly D2R cells. No significant differences were found in the number of c‐fos+/ChAT+ cells. For all cell countings: nstim+ = 5; nstim− = 5 in each group. Error bars denote SEM. **p < 0.01; ***p < 0.001

Similar articles

Cited by

References

    1. Al‐Hasani, R. , McCall, J. G. , Shin, G. , Gomez, A. M. , Schmitz, G. P. , Bernardi, J. M. , Pyo, C.‐O. , Park, S. I. , Marcinkiewcz, C. M. , Crowley, N. A. , Krashes, M. J. , Lowell, B. B. , Kash, T. L. , Rogers, J. A. , & Bruchas, M. R. (2015). Distinct subpopulations of nucleus accumbens dynorphin neurons drive aversion and reward. Neuron, 87(5), 1063–1077. 10.1016/j.neuron.2015.08.019 - DOI - PMC - PubMed
    1. Aragona, B. J. , Cleaveland, N. A. , Stuber, G. D. , Day, J. J. , Carelli, R. M. , & Wightman, R. M. (2008). Preferential enhancement of dopamine transmission within the nucleus accumbens shell by cocaine is attributable to a direct increase in phasic dopamine release events. Journal of Neuroscience, 28(35), 8821–8831. 10.1523/JNEUROSCI.2225-08.2008 - DOI - PMC - PubMed
    1. Bassareo, V. , Luca, M. A. D. , & Chiara, G. D. (2002). Differential expression of motivational stimulus properties by dopamine in nucleus accumbens shell versus core and prefrontal cortex. Journal of Neuroscience, 22(11), 4709–4719. 10.1523/JNEUROSCI.22-11-04709.2002 - DOI - PMC - PubMed
    1. Beier, K. T. , Steinberg, E. E. , DeLoach, K. E. , Xie, S. , Miyamichi, K. , Schwarz, L. , Gao, X. J. , Kremer, E. J. , Malenka, R. C. , & Luo, L. (2015). Circuit architecture of VTA dopamine neurons revealed by systematic input‐output mapping. Cell, 162(3), 622–634. 10.1016/j.cell.2015.07.015 - DOI - PMC - PubMed
    1. Beierholm, U. , Guitart‐Masip, M. , Economides, M. , Chowdhury, R. , Düzel, E. , Dolan, R. , & Dayan, P. (2013). Dopamine modulates reward‐related vigor. Neuropsychopharmacology, 38(8), 1495–1503. 10.1038/npp.2013.48 - DOI - PMC - PubMed

Publication types