. 2021 Aug 31;6(4):e0079321.
doi: 10.1128/mSystems.00793-21. Epub 2021 Aug 10.

Rapid, Large-Scale Wastewater Surveillance and Automated Reporting System Enable Early Detection of Nearly 85% of COVID-19 Cases on a University Campus

Affiliations

Rapid, Large-Scale Wastewater Surveillance and Automated Reporting System Enable Early Detection of Nearly 85% of COVID-19 Cases on a University Campus

Smruthi Karthikeyan et al. mSystems. .

Abstract

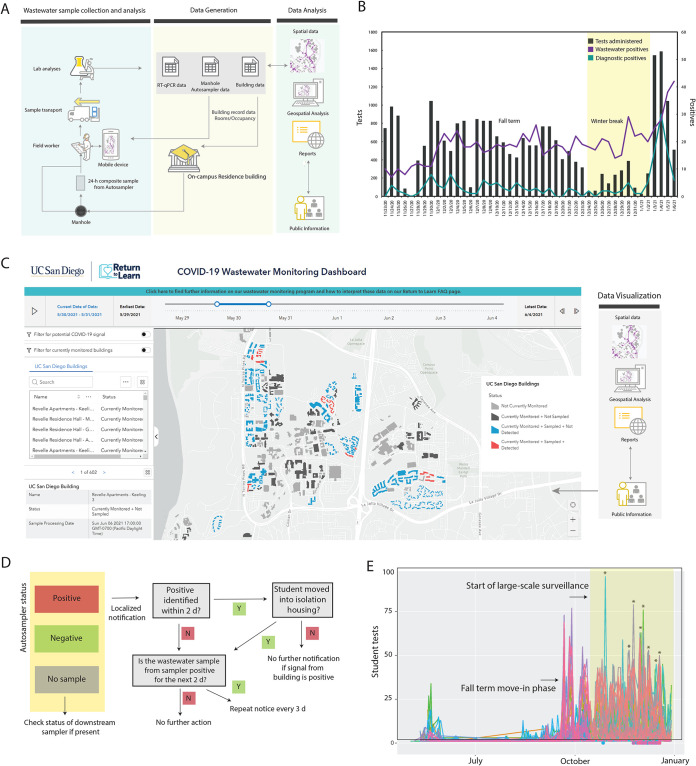
Wastewater-based surveillance has gained prominence and come to the forefront as a leading indicator of forecasting COVID-19 (coronavirus disease 2019) infection dynamics owing to its cost-effectiveness and its ability to inform early public health interventions. A university campus could especially benefit from wastewater surveillance, as universities are characterized by largely asymptomatic populations and are potential hot spots for transmission that necessitate frequent diagnostic testing. In this study, we employed a large-scale GIS (geographic information systems)-enabled building-level wastewater monitoring system associated with the on-campus residences of 7,614 individuals. Sixty-eight automated wastewater samplers were deployed to monitor 239 campus buildings with a focus on residential buildings. Time-weighted composite samples were collected on a daily basis and analyzed on the same day. Sample processing was streamlined significantly through automation, reducing the turnaround time by 20-fold and exceeding the scale of similar surveillance programs by 10- to 100-fold, thereby overcoming one of the biggest bottlenecks in wastewater surveillance. An automated wastewater notification system was developed to alert residents to a positive wastewater sample associated with their residence and to encourage uptake of campus-provided asymptomatic testing at no charge. This system, integrated with the rest of the "Return to Learn" program at the University of California (UC) San Diego-led to the early diagnosis of nearly 85% of all COVID-19 cases on campus. COVID-19 testing rates increased by 1.9 to 13× following wastewater notifications. Our study shows the potential for a robust, efficient wastewater surveillance system to greatly reduce infection risk as college campuses and other high-risk environments reopen. IMPORTANCE Wastewater-based epidemiology can be particularly valuable at university campuses where high-resolution spatial sampling in a well-controlled context could not only provide insight into what affects campus community as well as how those inferences can be extended to a broader city/county context. In the present study, a large-scale wastewater surveillance was successfully implemented on a large university campus enabling early detection of 85% of COVID-19 cases thereby averting potential outbreaks. The highly automated sample processing to reporting system enabled dramatic reduction in the turnaround time to 5 h (sample to result time) for 96 samples. Furthermore, miniaturization of the sample processing pipeline brought down the processing cost significantly ($13/sample). Taken together, these results show that such a system could greatly ameliorate long-term surveillance on such communities as they look to reopen.

Keywords: COVID-19; SARS-CoV-2; high-throughput; wastewater epidemiology.


Figures

FIG 1
FIG 1
High-throughput wastewater surveillance scheme. (A) Map showing the locations of the 68 actively deployed autosamplers (denoted in orange) across the campus residences. (B) Snapshot of one of the residence clusters showing the locations of 27 samplers covering one of the zones with the highest occupancy on campus. All autosamplers have unique IDs which have been prelinked to the corresponding manholes on the GIS server. (C) Timeline of the daily wastewater sampling and analysis. (D) An example of the wastewater sample data reported over two consecutive days. The numbers in the cells indicate the measured cycle threshold values of the N1 gene for the respective sample. Amplification in at least two/three genes for both replicates was considered positive. The samplers indicated in yellow were collected from the isolation dorms on campus. Building-specific data have been deidentified in accordance with university reporting policies. Maps are the intellectual property of Esri and its licensors and are used under license. Copyright © 2021 Esri and its licensors. All rights reserved.
FIG 2
FIG 2
Wastewater surveillance workflow implementation. (A) Sample collection to analysis workflow. (C) Diagnostic testing and wastewater data shown for a 45-day duration. A spike in the wastewater and subsequently diagnostic testing was observed prior to the start of the winter term on 4 January 2021 (move-in began on 1 January 2021). (C) The interactive public wastewater monitoring dashboard showing the buildings monitored (black) and potential buildings that contributed to a positive wastewater signal (red). The dashboard is updated daily. A slider at the top of the dashboard enables the viewing of historic data. The public-facing dashboard can be accessed at https://returntolearn.ucsd.edu/dashboard/index.html. (D) Fall quarter 2020 notification process in the case of a positive signal detection from any of the autosamplers. Note that for buildings with public bathrooms, a campus-wide notice was sent. 2 d, 2 days.(E) Student testing rates associated with each wastewater sampler positive during the study period. The colors represent the individual manholes where the samplers were deployed at and recorded at least one positive result during the study period. The dots shown below the x axis indicate that a notification was sent to these students on the corresponding date. Selected testing peaks following wastewater notifications are indicated by asterisks on the plot (further details are provided in Table S2 in the supplemental material). Maps and dashboard are the intellectual property of Esri and its licensors and are used under license. Copyright © 2021 Esri and its licensors. All rights reserved.
FIG 3
FIG 3
Quantitative interpretation of the wastewater data. (A) Snapshot of the sewer network showing the two autosamplers by isolation unit AS017 is downstream of sampler AS019 (associated with the isolation dorm). The mean Cq values of the daily samples from the two samplers are shown in the bottom panel. (B) Mean viral gene copies per liter of sewage collected daily from the isolation dorms (sampler AS019) compared to the number of students in isolation/quarantine on the same day. (C) Measured daily caseload data compared to the predicted filter output with a 1-day sampling delay for all active on-campus samplers (mean, 0.67; root mean square error [RMSE], 1.5). (D). Measured daily caseload data compared to the predicted filter output with a 1-day sampling delay for the isolation unit sampler AS019 (mean 0.80, RMSE 6.8). Maps are the intellectual property of Esri and its licensors and are used under license. Copyright © 2021 Esri and its licensors. All rights reserved.

References

    1. Lago PM, Gary HE, Jr, Pérez LS, Cáceres V, Olivera JB, Puentes RP, Corredor MB, Jímenez P, Pallansch MA, Cruz RG. 2003. Poliovirus detection in wastewater and stools following an immunization campaign in Havana, Cuba. Int J Epidemiol 32:772–777. doi:10.1093/ije/dyg185. - DOI - PubMed
    1. Sims N, Kasprzyk-Hordern B. 2020. Future perspectives of wastewater-based epidemiology: monitoring infectious disease spread and resistance to the community level. Environ Int 139:105689. doi:10.1016/j.envint.2020.105689. - DOI - PMC - PubMed
    1. Peccia J, Zulli A, Brackney DE, Grubaugh ND, Kaplan EH, Casanovas-Massana A, Ko AI, Malik AA, Wang D, Wang M, Warren JL, Weinberger DM, Arnold W, Omer SB. 2020. Measurement of SARS-CoV-2 RNA in wastewater tracks community infection dynamics. Nat Biotechnol 38:1164–1167. doi:10.1038/s41587-020-0684-z. - DOI - PMC - PubMed
    1. Larsen DA, Wigginton KR. 2020. Tracking COVID-19 with wastewater. Nat Biotechnol 38:1151–1153. doi:10.1038/s41587-020-0690-1. - DOI - PMC - PubMed
    1. Karthikeyan S, Ronquillo N, Belda-Ferre P, Alvarado D, Javidi T, Longhurst CA, Knight R. 2021. High-throughput wastewater SARS-CoV-2 detection enables forecasting of community infection dynamics in San Diego County. mSystems 6:e00045-21. doi:10.1128/mSystems.00045-21. - DOI - PMC - PubMed