Observational Study
. 2022 May 3;74(9):1525-1533.
doi: 10.1093/cid/ciab686.

Severe Acute Respiratory Syndrome Coronavirus 2 Viremia Is Associated With Coronavirus Disease 2019 Severity and Predicts Clinical Outcomes

Affiliations
Observational Study

Severe Acute Respiratory Syndrome Coronavirus 2 Viremia Is Associated With Coronavirus Disease 2019 Severity and Predicts Clinical Outcomes

Jana L Jacobs et al. Clin Infect Dis. .

Abstract

Background: Severe acute respiratory syndrome coronavirus 2 (SARS-CoV-2) viral RNA (vRNA) is detected in the bloodstream of some patients with coronavirus disease 2019 (COVID-19), but it is not clear whether this RNAemia reflects viremia (ie, virus particles) and how it relates to host immune responses and outcomes.

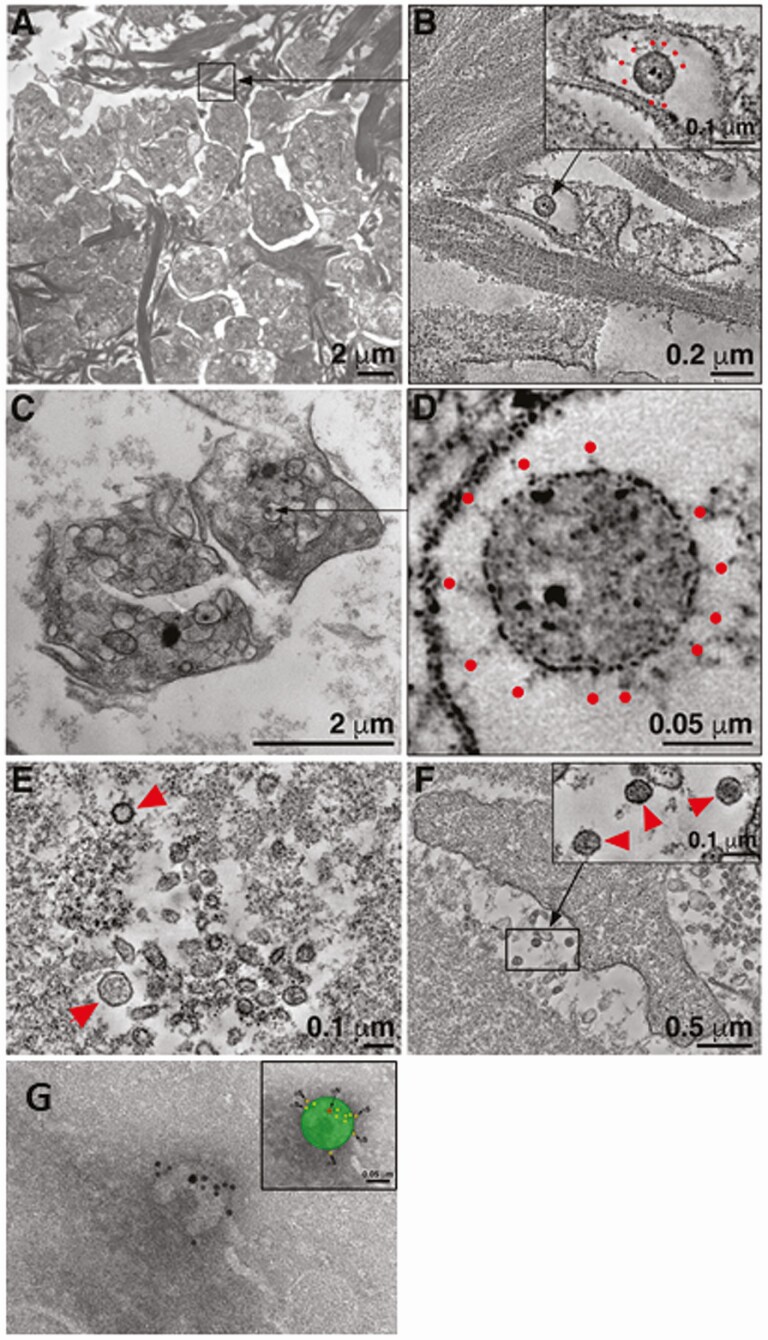
Methods: SARS-CoV-2 vRNA was quantified in plasma samples from observational cohorts of 51 COVID-19 patients including 9 outpatients, 19 hospitalized (non-intensive care unit [ICU]), and 23 ICU patients. vRNA levels were compared with cross-sectional indices of COVID-19 severity and prospective clinical outcomes. We used multiple imaging methods to visualize virions in plasma.

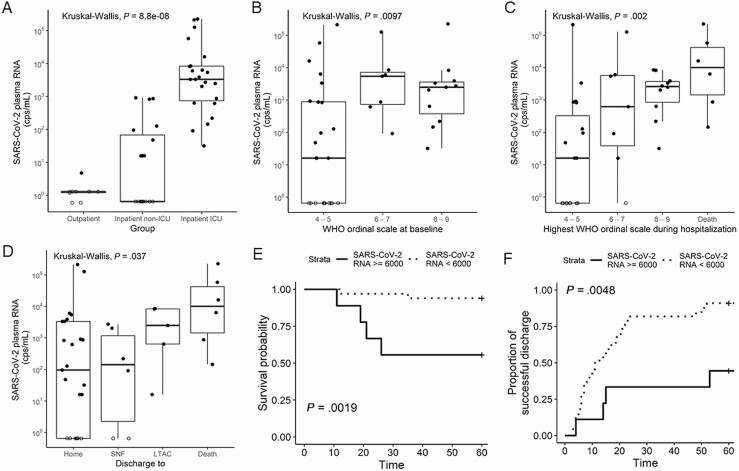
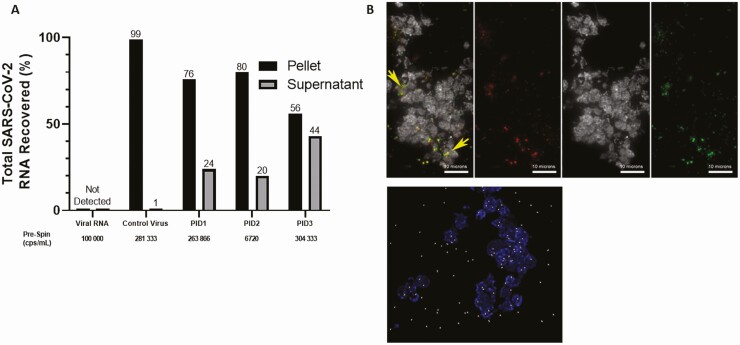
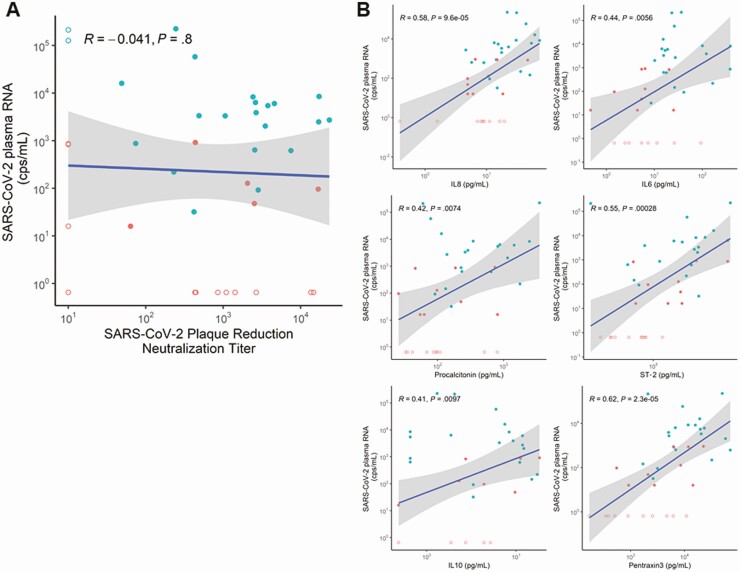
Results: SARS-CoV-2 vRNA was detected in plasma of 100%, 52.6%, and 11.1% of ICU, non-ICU, and outpatients, respectively. Virions were detected in plasma pellets using electron tomography and immunostaining. Plasma vRNA levels were significantly higher in ICU > non-ICU > outpatients (P < .0001); for inpatients, plasma vRNA levels were strongly associated with higher World Health Organization (WHO) score at admission (P = .01), maximum WHO score (P = .002), and discharge disposition (P = .004). A plasma vRNA level >6000 copies/mL was strongly associated with mortality (hazard ratio, 10.7). Levels of vRNA were significantly associated with several inflammatory biomarkers (P < .01) but not with plasma neutralizing antibody titers (P = .8).

Conclusions: Visualization of virus particles in plasma indicates that SARS-CoV-2 RNAemia is due, at least in part, to viremia. The levels of SARS-CoV-2 RNAemia correlate strongly with disease severity, patient outcome, and specific inflammatory biomarkers but not with neutralizing antibody titers.

Keywords: 19 outcome; 2 RNAemia; 2 viremia; COVID; CoV; SARS.


Figures

Figure 1.
Figure 1.
SARS-CoV-2 RNA levels in plasma are associated with disease severity and outcome. Plasma SARS-CoV-2 RNA levels (copies per milliliter) by location of clinical care at baseline (A), severity of illness by WHO ordinal scale at baseline (B), and worst WHO scale during hospitalization (C) for outpatient (n = 9), inpatient non-ICU (n = 19), and inpatient ICU (n = 24). Kaplan-Meier curves for time to discharge from hospital admission (D) and 60-day survival (E) for inpatients (both ICU and non-ICU) stratified by high (>6000 copies/mL) vs low (≤6000 copies/mL) initial viral RNA level. Plasma SARS-CoV-2 RNA levels (copies per milliliter) by outcome of hospitalization among inpatients (F). Patients with undetected SARS-CoV-2 RNA in plasma are represented by open circles and graphed as one-half the Lower limit of detection (LLOD). Abbreviations: cps, copies; ICU, intensive care unit; LTAC, long-term acute care; SARS-CoV-2, severe acute respiratory syndrome coronavirus 2; SNF, skilled nursing facility; WHO, World Health Organization.
Figure 2.
Figure 2.
SARS-CoV-2 RNA in plasma includes a pelletable fraction that contains virus particles. A, Percent of total recovered SARS-CoV-2 RNA detected in the pellet or supernatant fractions of spiked-in control SARS-CoV-2 virus or plasma from 3 inpatients with coronavirus disease 2019 (COVID-19) centrifuged at 21 000 × g for 2 hours. B, Immunofluorescence of cytospin slides prepared from plasma of COVID-19 inpatients PID3 (upper) and PID2 (lower) including the platelet marker CD41 (upper, white; lower, blue), and SARS-CoV-2 S and N proteins (upper, red and green or yellow for colocalization; lower, white). Abbreviations: cps, copies; PID, patient identifier; SARS-CoV-2, severe acute respiratory syndrome coronavirus 2.
Figure 3.
Figure 3.
Severe acute respiratory syndrome coronavirus 2 (SARS-CoV-2) RNA in plasma includes a pelletable fraction containing SARS-CoV-2 virus particles. Electron micrographs of pelleted fraction of plasma from 2 independent coronavirus disease 2019 inpatients, PID2 (A, B, and G) and PID1 (C–F). Montaged overview of a field of platelets surrounded by amorphous plasma material and large clusters of fibrils, possibly collagen (A, B). B, Tomographic reconstruction of the region indicated by the square in upper left showing a single presumptive SARS-CoV-2 virion within a membrane-bound compartment of a platelet. C, Tomogram detail of the virion with notable core puncta, clearly delineated membrane bilayer, and distinct surface spikes (B, red dots). Two-dimensional overview image of 3 platelets. D, High-magnification tomographic slice of a presumptive SARS-CoV-2 virion within an enclosed compartment of a platelet. Tomogram detail of a group of vesicles. Two spherical structures conform to presumptive SARS-CoV-2 virions (E, red arrowheads). F, Tomogram of a second platelet within the field, similarly surrounded by small vesicles. Tomogram detail of the area indicated by the rectangle in F showing 3 presumptive virions adjacent to the platelet (F, inset). Presumptive virions were identified as described (Methods section) and by comparisons with analogous electron microscopy (EM) of SARS-CoV-2–infected cultured cells. Immuno-EM image from pelleted fraction of plasma of PID2; presumptive SARS-CoV-2 virion labeled with anti-N (large 15 nm) gold particle and anti-S (smaller 10 nm) gold particles (G).
Figure 4.
Figure 4.
Plasma SARS-CoV-2 RNA levels are not significantly correlated with SARS-CoV-2–specific neutralizing antibody levels but are correlated with multiple host-response inflammatory biomarkers in hospitalized patients. Correlations between SARS-CoV-2 RNA levels and anti–SARS-CoV-2 neutralizing antibodies measured by plaque reduction neutralization titer assay (A) or the inflammatory biomarkers IL-8, IL-6, procalcitonin, ST-2, IL10, and pentraxin 3 measured in the plasma of coronavirus disease 2019 inpatients (B). Red dots represent non–intensive care unit (ICU) patients, and blue dots represent ICU patients. Undetected values are represented by open circles and graphed as one-half the lower limit of detection (LLOD). Abbreviations: cps, copies; IL, interleukin; SARS-CoV-2, severe acute respiratory syndrome coronavirus 2; ST-2, suppression of tumorigenicity 2.

References

    1. Zhu N, Zhang D, Wang W, et al. . A novel coronavirus from patients with pneumonia in China, 2019. N Engl J Med 2020; 382:727-33. - PMC - PubMed
    1. Wu F, Zhao S, Yu B, et al. . A new coronavirus associated with human respiratory disease in China. Nature 2020; 579:265-9. - PMC - PubMed
    1. Wiersinga WJ, Rhodes A, Cheng AC, Peacock SJ, Prescott HC. Pathophysiology, transmission, diagnosis, and treatment of coronavirus disease 2019 (COVID-19): a review. JAMA 2020; 324:782-93. - PubMed
    1. Lamers MM, Beumer J, van der Vaart J, et al. . SARS-CoV-2 productively infects human gut enterocytes. Science 2020; 369:50-4. - PMC - PubMed
    1. Puelles VG, Lütgehetmann M, Lindenmeyer MT, et al. . Multiorgan and renal tropism of SARS-CoV-2. N Engl J Med 2020; 383:590-2. - PMC - PubMed

Publication types