

Potent Tau Aggregation Inhibitor D-Peptides Selected against Tau-Repeat 2 Using Mirror Image Phage Display
- PMID: 34375027
- PMCID: PMC8596876
- DOI: 10.1002/cbic.202100287
Potent Tau Aggregation Inhibitor D-Peptides Selected against Tau-Repeat 2 Using Mirror Image Phage Display
Abstract
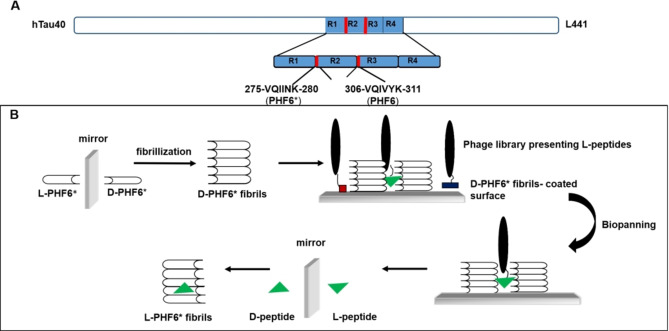
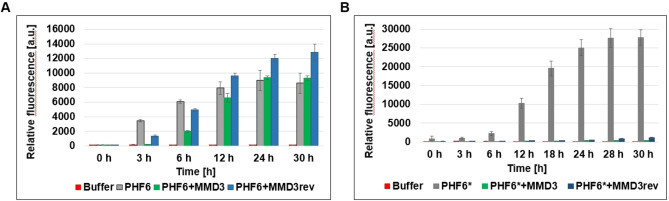
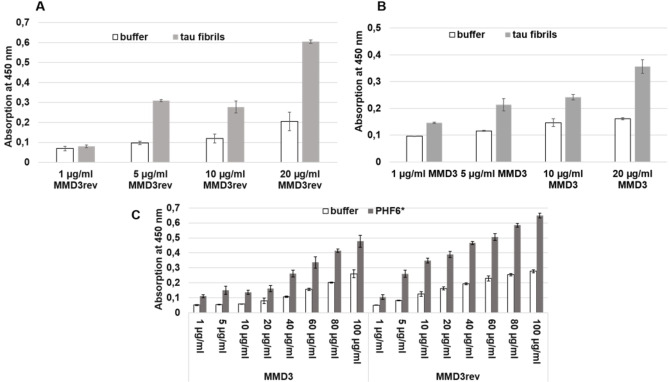
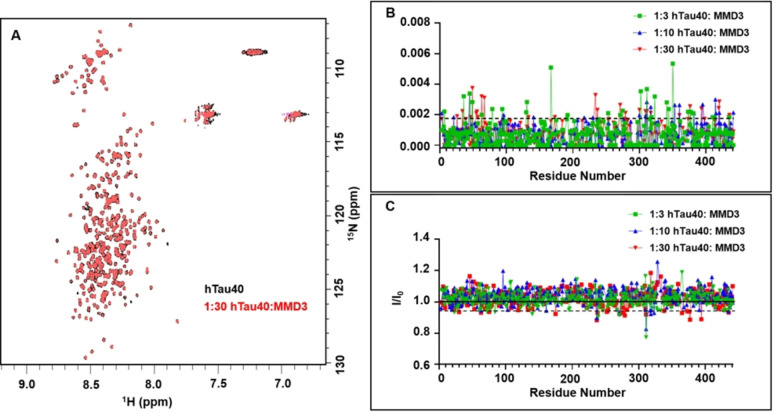
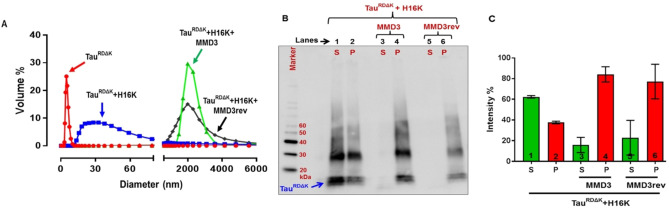
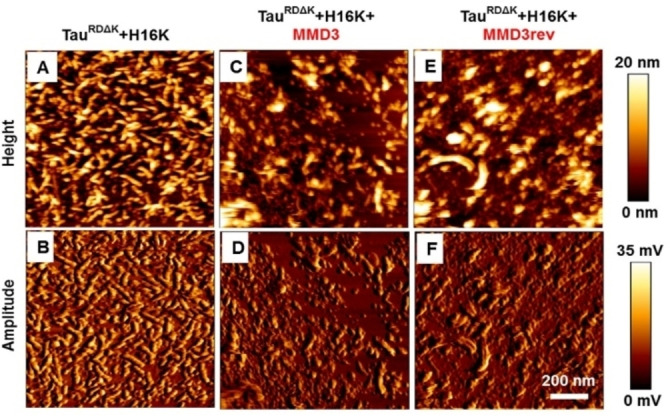
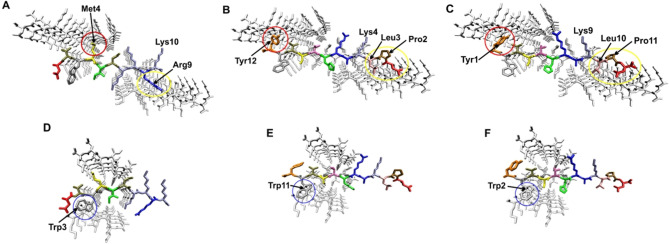
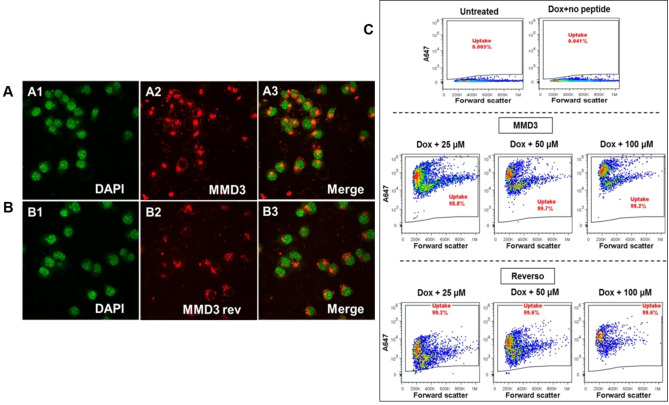
Alzheimer's disease and other Tauopathies are associated with neurofibrillary tangles composed of Tau protein, as well as toxic Tau oligomers. Therefore, inhibitors of pathological Tau aggregation are potentially useful candidates for future therapies targeting Tauopathies. Two hexapeptides within Tau, designated PHF6* (275-VQIINK-280) and PHF6 (306-VQIVYK-311), are known to promote Tau aggregation. Recently, the PHF6* segment has been described as the more potent driver of Tau aggregation. We therefore employed mirror-image phage display with a large peptide library to identify PHF6* fibril binding peptides consisting of D-enantiomeric amino acids. The suitability of D-enantiomeric peptides for in vivo applications, which are protease stable and less immunogenic than L-peptides, has already been demonstrated. The identified D-enantiomeric peptide MMD3 and its retro-inverso form, designated MMD3rev, inhibited in vitro fibrillization of the PHF6* peptide, the repeat domain of Tau as well as full-length Tau. Dynamic light scattering, pelleting assays and atomic force microscopy demonstrated that MMD3 prevents the formation of tau β-sheet-rich fibrils by diverting Tau into large amorphous aggregates. NMR data suggest that the D-enantiomeric peptides bound to Tau monomers with rather low affinity, but ELISA (enzyme-linked immunosorbent assay) data demonstrated binding to PHF6* and full length Tau fibrils. In addition, molecular insight into the binding mode of MMD3 to PHF6* fibrils were gained by in silico modelling. The identified PHF6*-targeting peptides were able to penetrate cells. The study establishes PHF6* fibril binding peptides consisting of D-enantiomeric amino acids as potential molecules for therapeutic and diagnostic applications in AD research.
Keywords: Alzheimer's disease; D-peptides; phage display; tau aggregation inhibitors; therapy.
© 2021 The Authors. ChemBioChem published by Wiley-VCH GmbH.
Conflict of interest statement
The authors declare no conflict of interest.
Figures
Similar articles
-
Mirror-Image Phage Display for the Selection of D-Amino Acid Peptide Ligands as Potential Therapeutics.Curr Protoc. 2024 Feb;4(2):e957. doi: 10.1002/cpz1.957. Curr Protoc. 2024. PMID: 38372457
-
Selection of a d-Enantiomeric Peptide Specifically Binding to PHF6 for Inhibiting Tau Aggregation in Transgenic Mice.ACS Chem Neurosci. 2020 Dec 16;11(24):4240-4253. doi: 10.1021/acschemneuro.0c00518. Epub 2020 Dec 7. ACS Chem Neurosci. 2020. PMID: 33284003
-
Selection and Characterization of Tau Binding ᴅ-Enantiomeric Peptides with Potential for Therapy of Alzheimer Disease.PLoS One. 2016 Dec 22;11(12):e0167432. doi: 10.1371/journal.pone.0167432. eCollection 2016. PLoS One. 2016. PMID: 28006031 Free PMC article.
-
Tau Aggregation Inhibiting Peptides as Potential Therapeutics for Alzheimer Disease.Cell Mol Neurobiol. 2023 Apr;43(3):951-961. doi: 10.1007/s10571-022-01230-7. Epub 2022 May 21. Cell Mol Neurobiol. 2023. PMID: 35596819 Free PMC article. Review.
-
Tau protein aggregation in Alzheimer's disease: An attractive target for the development of novel therapeutic agents.Eur J Med Chem. 2017 Oct 20;139:153-167. doi: 10.1016/j.ejmech.2017.07.070. Epub 2017 Jul 29. Eur J Med Chem. 2017. PMID: 28800454 Review.
Cited by
-
β-Bracelets: Macrocyclic Cross-β Epitope Mimics Based on a Tau Conformational Strain.J Am Chem Soc. 2023 Oct 25;145(42):23131-23142. doi: 10.1021/jacs.3c06830. Epub 2023 Oct 16. J Am Chem Soc. 2023. PMID: 37844142 Free PMC article.
-
Design and Synthesis of Monobody Variants with Low Immunogenicity.ACS Med Chem Lett. 2023 Oct 9;14(11):1596-1601. doi: 10.1021/acsmedchemlett.3c00342. eCollection 2023 Nov 9. ACS Med Chem Lett. 2023. PMID: 37974939 Free PMC article.
-
Deciphering the Synthetic and Refolding Strategy of a Cysteine-Rich Domain in the Tumor Necrosis Factor Receptor (TNF-R) for Racemic Crystallography Analysis and d-Peptide Ligand Discovery.ACS Bio Med Chem Au. 2023 Dec 11;4(1):68-76. doi: 10.1021/acsbiomedchemau.3c00060. eCollection 2024 Feb 21. ACS Bio Med Chem Au. 2023. PMID: 38404743 Free PMC article.
-
Emerging trends in nucleic acid and peptide aptamers in plant science research.Planta. 2025 Feb 20;261(3):63. doi: 10.1007/s00425-025-04637-w. Planta. 2025. PMID: 39979676 Free PMC article. Review.
-
Tau- and α-synuclein-targeted gold nanoparticles: applications, opportunities, and future outlooks in the diagnosis and therapy of neurodegenerative diseases.J Nanobiotechnology. 2024 May 13;22(1):248. doi: 10.1186/s12951-024-02526-0. J Nanobiotechnology. 2024. PMID: 38741193 Free PMC article. Review.
References
Publication types
MeSH terms
Substances
Grants and funding
LinkOut - more resources
Full Text Sources
Other Literature Sources
