. 2021 Aug 25;143(33):13299-13313.
doi: 10.1021/jacs.1c06339. Epub 2021 Aug 10.

Constraints on the Structure of Fibrils Formed by a Racemic Mixture of Amyloid-β Peptides from Solid-State NMR, Electron Microscopy, and Theory

Affiliations

Constraints on the Structure of Fibrils Formed by a Racemic Mixture of Amyloid-β Peptides from Solid-State NMR, Electron Microscopy, and Theory

Jevgenij A Raskatov et al. J Am Chem Soc. .

Abstract

Previous studies have shown that racemic mixtures of 40- and 42-residue amyloid-β peptides (d,l-Aβ40 and d,l-Aβ42) form amyloid fibrils with accelerated kinetics and enhanced stability relative to their homochiral counterparts (l-Aβ40 and l-Aβ42), suggesting a "chiral inactivation" approach to abrogating the neurotoxicity of Aβ oligomers (Aβ-CI). Here we report a structural study of d,l-Aβ40 fibrils, using electron microscopy, solid-state nuclear magnetic resonance (NMR), and density functional theory (DFT) calculations. Two- and three-dimensional solid-state NMR spectra indicate molecular conformations in d,l-Aβ40 fibrils that resemble those in known l-Aβ40 fibril structures. However, quantitative measurements of 13C-13C and 15N-13C distances in selectively labeled d,l-Aβ40 fibril samples indicate a qualitatively different supramolecular structure. While cross-β structures in mature l-Aβ40 fibrils are comprised of in-register, parallel β-sheets, our data indicate antiparallel β-sheets in d,l-Aβ40 fibrils, with alternation of d and l molecules along the fibril growth direction, i.e., antiparallel "rippled sheet" structures. The solid-state NMR data suggest the coexistence of d,l-Aβ40 fibril polymorphs with three different registries of intermolecular hydrogen bonds within the antiparallel rippled sheets. DFT calculations support an energetic preference for antiparallel alignments of the β-strand segments identified by solid-state NMR. These results provide insight into the structural basis for Aβ-CI and establish the importance of rippled sheets in self-assembly of full-length, naturally occurring amyloidogenic peptides.


Figures

Figure 1:
Figure 1:
Negative-stain TEM images of D,L-Aβ40 fibrils. (A,B) 3NL,3CL-D,L-Aβ40 fibrils after 16 h and 100 h of incubation, respectively. (C,D) UL-D,L-Aβ40 fibrils after 120 h of incubation. In both cases, fibrils were grown under quiescent conditions in PBS at 24° C and pH 7.4 with a total peptide concentration of 40 μM. Peptides were disaggregated in 20 mM NaOH prior to mixing and dilution into PBS.
Figure 2:
Figure 2:
2D 13C-13C (A), NCACX (B) and NCOCX (C) solid state NMR spectra of UL-D,L-Aβ40 fibrils. 1D slices above each 2D spectrum are taken at positions indicated by dashed lines. Contour levels increase by successive factors of 1.4. Crosspeak assignments were obtained from 3D solid state NMR spectra (see Fig. 3).
Figure 3:
Figure 3:
Examples of 2D planes from 3D solid state NMR spectra of UL-D,L-Aβ40 fibrils. 13C-13C planes from 3D NCACX (A,B), NCOCX (C,D), and CANCX (E,F) spectra are shown at 15N chemical shifts of 120.5 ppm (A,C,E) and 126.6 ppm (B,D,F). 1D slices in each panel are taken at positions indicated by dashed lines. Contour levels increase by successive factors of 1.4. Assignments are shown for crosspeaks with 15N chemicals shifts within ±1.5 ppm of the indicated values.
Figure 4:
Figure 4:
(A) 2D 1H-13C INEPT spectrum of UL-D,L-Aβ40 fibrils, showing signals from residues that remain dynamically disordered. Residue-type assignments are based on standard random-coil chemical shifts. The 1D slice above the 2D spectrum is taken at the position indicated by the dashed line. Contour levels increase by successive factors of 1.4. (B) Aβ40 sequence, with β-strand segments in blue, additional residues with assigned solid state NMR signals in purple, and the dynamically disordered N-terminal segment in red.
Figure 5:
Figure 5:
(A) Measurements of 13C-13C dipole-dipole couplings in 3NL,3CL-D,L-Aβ40 fibrils (blue circles) and L-Aβ40 fibrils with 13C labels at carbonyl sites of I31, G33, and M35 (red triangles), using the PITHIRDS-CT solid state NMR technique. Signal amplitudes are normalized to 100 at an evolution time of zero. Error bars are uncertainties due to the root-mean-squared noise in the experimental spectra. Solid, dashed, dotted, and dash-dotted lines are numerical simulations of PITHIRDS-CT data for linear chains of 13C nuclei with the indicated internuclear distances. (B) Measurements of 15N-13C dipole-dipole couplings in 2CL,2ND-D,L-Aβ40 (blue triangles and red squares for fully hydrated and lyophilized fibrils, respectively), using the 13C-detected REDOR solid state NMR technique. REDOR data for Ac-KLVFFAE-NH2 fibrils with amide 15N and carbonyl 13C labels at V3 and F5 are also shown (purple circles). Solid and dotted lines are REDOR simulations for hypothetical antiparallel and in-register parallel rippled sheet structures, respectively, for D,L-Aβ40 fibrils. The dashed line is a REDOR simulation for Ac-KLVFFAE-NH2 fibrils with their known intermolecular V3-F5 hydrogen bonds. (C) REDOR data for 3NL,3CL,2ND-D,L-Aβ40 fibrils. Results for the carbonyl 13C signals of G33 (red squares) and I31/M35 (unresolved, blue circles) are plotted separately. Lines are two-spin REDOR simulations for the indicated 15N-13C distances, scaled by a factor of 0.38. (D) Contour plot of the χ2 deviation between experimental REDOR data for D,L-Aβ40 fibrils and simulations in which the relative populations of antiparallel rippled sheets with three possible hydrogen bond registries were varied.
Figure 6:
Figure 6:
Models for β-sheets formed by residues 29–37 of Aβ40 (sequence GAIIGLMVG), with alternation between D and L molecules along the intermolecular hydrogen bonding direction. (A) In-register, parallel β-sheet model. Carbon-carbon distance d1 is 4.8 Å. Nitrogen-carbon distances d2 and d3 are 4.1 Å and 5.8 Å, respectively. (B) Antiparallel β-sheet model with 33+k ↔ 33-k registry. Nitrogen-carbon distances d4 and d5 from the carbonyl carbon of G33 in L-Aβ40 are 4.1 Å and 5.9 Å. Distances d6 and d7 from the carbonyl carbon of I32 are 6.0 Å and 6.4 Å. (C,D) Antiparallel β-sheet models with 33+k ↔ 32-k and 33+k ↔ 34-k registry. Distances d8 and d10 are 6.4 Å, and d9 and d11 are 6.0 Å. With 33+k ↔ 32-k registry, d10 and d11 are distances from the carbonyl carbon of I31. With 33+k ↔ 34-k registry, d10 and d11 are distances from the carbonyl carbon of M35. (E) Cartoon representation of an in-register, parallel cross-β motif comprised of alternating D and L peptides with S-shaped conformations. (F) Cartoon representation of an antiparallel cross-β motif comprised of alternating D and L peptides with U-shaped conformations.
Figure 7:
Figure 7:
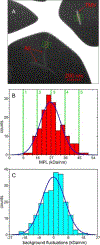
(A) Example of a dark-field TEM image of unstained D,L-Aβ40 fibrils. MPL values were determined from integrated image intensities within 100 nm × 40 nm areas (yellow rectangles) after subtraction of integrated background intensities (green rectangles). Intensities were calibrated by similar measurements on co-adsorbed tobacco mosaic virus rods (TMV). (B) Histogram of MPL values, obtained from 163 fibril segments and 43 TMV segments in measurements in 27 dark-field images. Blue line is a best-fit Gaussian curve, centered at 26.6 ± 0.5 kDa/nm with 15.8 ± 1.2 kDa/nm full-width-at-half-maximum. Vertical green lines indicate ideal MPL values for hypothetical structures with 1–5 cross-β subunits. (C) Histogram of the expected errors in MPL values due to background noise fluctuations in individual dark-field images. Blue line is a best-fit Gaussian curve, centered at 0.0 kDa/nm with 16.6 ± 1.0 kDa/nm full-width-at-half-maximum.
Figure 8:
Figure 8:
DFT-optimized partial structures corresponding to the rippled LVFFA:lvffa (top) and IIGLM:iiglm (bottom) in either antiparallel (left) or parallel (right) orientation. In each case, two views are shown, rotated by 90° about a horizontal line. Structures are shown in both stick and space-filling representations. Relative energies Erel are given in kcal/mol.

Similar articles

Cited by

References

    1. Selkoe DJ; Hardy J, The amyloid hypothesis of Alzheimer’s disease at 25 years. EMBO Mol. Med 2016, 8, 595–608. - PMC - PubMed
    1. Gravina SA; Ho LB; Eckman CB; Long KE; Otvos L; Younkin LH; Suzuki N; Younkin SG, Amyloid-β protein (Aβ) in Alzheimers-disease brain: Biochemical and immunocytochemical analysis with antibodies specific for forms ending at Aβ40 or Aβ42(43). J. Biol. Chem 1995, 270, 7013–7016. - PubMed
    1. Goldsbury C; Frey P; Olivieri V; Aebi U; Muller SA, Multiple assembly pathways underlie amyloid-β fibril polymorphisms. J. Mol. Biol 2005, 352, 282–298. - PubMed
    1. Antzutkin ON; Balbach JJ; Leapman RD; Rizzo NW; Reed J; Tycko R, Multiple quantum solid-state NMR indicates a parallel, not antiparallel, organization of β-sheets in Alzheimer’s β-amyloid fibrils. Proc. Natl. Acad. Sci. USA 2000, 97, 13045–13050. - PMC - PubMed
    1. Petkova AT; Leapman RD; Guo ZH; Yau WM; Mattson MP; Tycko R, Self-propagating, molecular-level polymorphism in Alzheimer’s β-amyloid fibrils. Science 2005, 307, 262–265. - PubMed

Publication types