. 2021 Aug 23;61(8):3988-3999.
doi: 10.1021/acs.jcim.1c00315. Epub 2021 Aug 10.

Quaternary Structure Transitions of Human Hemoglobin: An Atomic-Level View of the Functional Intermediate States

Affiliations

Quaternary Structure Transitions of Human Hemoglobin: An Atomic-Level View of the Functional Intermediate States

Nicole Balasco et al. J Chem Inf Model. .

Abstract

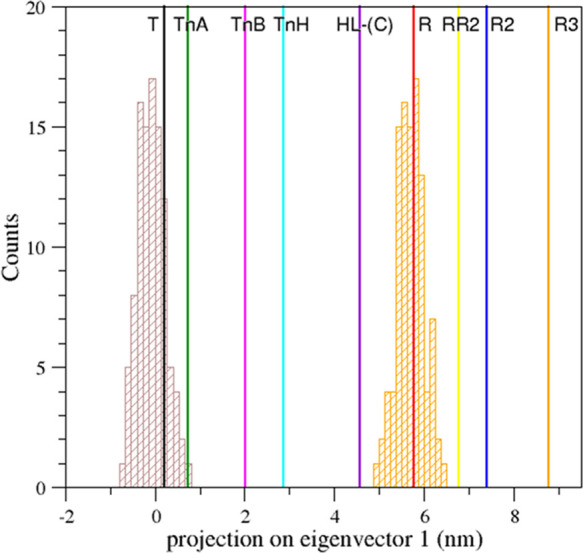
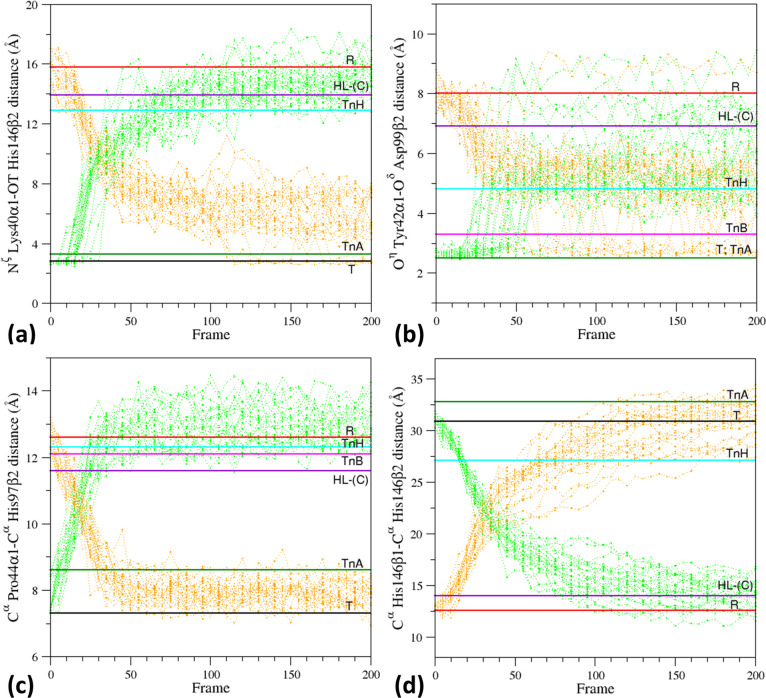
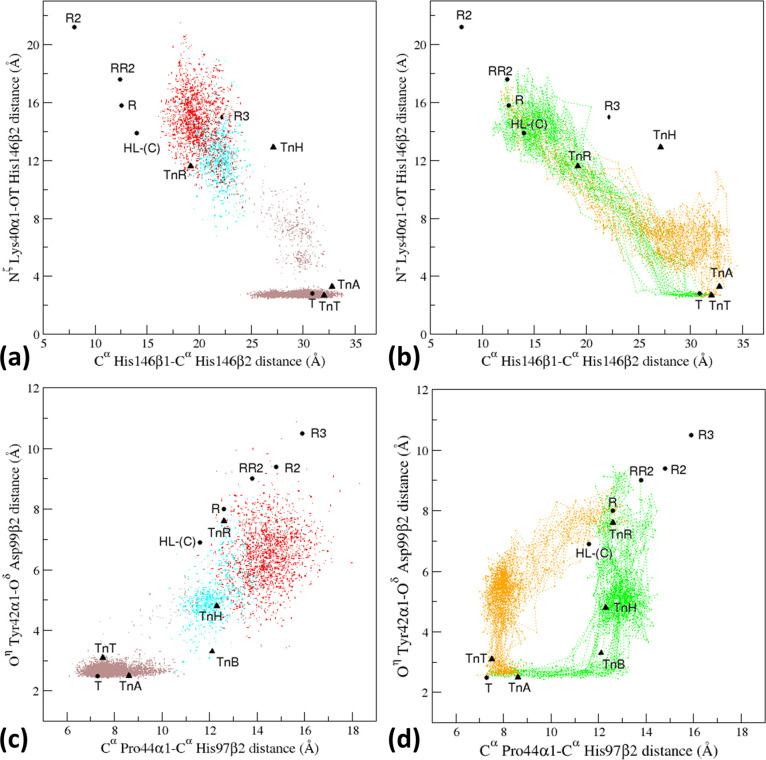
Human hemoglobin (HbA) is one of the prototypal systems used to investigate structure-function relationships in proteins. Indeed, HbA has been used to develop the basic concepts of protein allostery, although the atomic-level mechanism underlying the HbA functionality is still highly debated. This is due to the fact that most of the three-dimensional structural information collected over the decades refers to the endpoints of HbA functional transition with little data available for the intermediate states. Here, we report molecular dynamics (MD) simulations by focusing on the relevance of the intermediate states of the protein functional transition unraveled by the crystallographic studies carried out on vertebrate Hbs. Fully atomistic simulations of the HbA T-state indicate that the protein undergoes a spontaneous transition toward the R-state. The inspection of the trajectory structures indicates that the protein significantly populates the intermediate HL-(C) state previously unraveled by crystallography. In the structural transition, it also assumes the intermediate states crystallographically detected in Antarctic fish Hbs. This finding suggests that HbA and Antarctic fish Hbs, in addition to the endpoints of the transitions, also share a similar deoxygenation pathway despite a distace of hundreds of millions of years in the evolution scale. Finally, using the essential dynamic sampling methodology, we gained some insights into the reverse R to T transition that is not spontaneously observed in classic MD simulations.


Conflict of interest statement

The authors declare no competing financial interest.

Figures

Figure 1
Figure 1
Stepwise R–T transition of HbTn as highlighted by crystallographic investigations carried out on the protein. Superimposition of the α1β1 dimer of different HbTn structural states: deoxygenated T-state (TnT, black, PDB ID: 3NFE), TnA (green, PDB ID: 5LFG), TnB (magenta, PDB ID: 5LFG), TnH (cyan, PDB ID: 3D1K), and the canonical R-state (TnR, red, PDB ID: 1T1N). Magnifications of the helices A (residue 3–18) and G (residues 99–117) of the β2 subunit are shown to highlight the transition from the T- to the R-state.
Figure 2
Figure 2
(a) RMSD values (computed on the Cα atoms) of the T0 trajectory structures versus the starting T model (black, PDB ID: 2DN2), the R-state (red, PDB ID: 2DN1), and the intermediate HL-(C) state (violet, PDB ID: 4N7P). (b) RMSD values computed against the off-pathway structures: R2 (blue, PDB ID: 1BBB), RR2 (yellow, PDB ID: 1MKO), and R3 (orange, PDB ID: 4NI0). (c) RMSD values computed against the intermediate states identified for HbTn: TnA (green, PDB ID: 5LFG), TnB (magenta, PDB ID: 5LFG), and TnH (cyan, PDB ID: 3D1K) (C). (d) RMSD values computed against the T-state (black) and the R-state (red) of HbA and against TnH (cyan) in the time interval of 60–100 ns. RMSD values refer to the productive run without the equilibration steps producing the initial drift.
Figure 3
Figure 3
Projection on the first eigenvector of the T0 trajectory structures. The vertical solid lines correspond to the projections of the crystallographic structures of human HbA states: T (black, PDB ID: 2DN2), R (red, PDB ID: 2DN1), intermediate HL-(C) (violet, PDB ID: 4N7P), R2 (blue, PDB ID: 1BBB), RR2 (yellow, PDB ID: 1MKO), and R3 (orange, PDB ID: 4NI0) and of the HbTn intermediates: TnA (green, PDB ID: 5LFG), TnB (magenta, PDB ID: 5LFG), and TnH (cyan, PDB ID: 3D1K). Dashed lines correspond to the projections of crystallographic structures showing remarkable tertiary structure variations as oxy HbA T-state (black, PDB ID: 1GZX) and high-salt carbonmonoxy HbA (red, PDB ID: 1LJW) and of the crystallographic structures of cross-linked carbonmonoxy HbAs (violet, PDB IDs: 1SDK and 1SDL).
Figure 4
Figure 4
Time evolution in the T0 simulation of the structural probes that are characteristic of the different HbA states. Specifically, the distances (a) Nζ Lys40α1–OT His146β2, (b) Oη Tyr42α1–Oδ Asp99β2, (c) Cα Pro44α1–Cα His97β2, and (d) Cα His146β1–Cα His146β2 are monitored.
Figure 5
Figure 5
Projection on the first eigenvector of the trajectory structures extracted from the first 1 ns of the T0 (gray) and R4 (orange) simulations. The vertical lines correspond to the projections of the crystallographic structures of human HbA states—T (black, PDB ID: 2DN2), R (red, PDB ID: 2DN1), intermediate HL-(C) (violet, PDB ID: 4N7P), R2 (blue, PDB ID: 1BBB), RR2 (yellow, PDB ID: 1MKO), and R3 (orange, PDB ID: 4NI0)—and that of HbTn intermediates—TnA (green, PDB ID: 5LFG), TnB (magenta, PDB ID: 5LFG), and TnH (cyan, PDB ID: 3D1K).
Figure 6
Figure 6
Evolution in the EDS of the structural probes that are characteristic of the different HbA states. Specifically, the distances (a) Nζ Lys40α1–OT His146β2, (b) Oη Tyr42α1–Oδ Asp99β2, (c) Cα Pro44α1–Cα His97β2, and (d) Cα His146β1–Cα His146β2 are monitored in the T–R (green) and R–T (orange) trajectory structures.
Figure 7
Figure 7
Projections of the T0 trajectory structures (a, c) and of the T–R (green) and R–T (orange) trajectory structures generated by the EDS analysis (b, d) in the space defined by some structural probes that are characteristic of the various HbA states. The points corresponding to the structures detected in the pretransition (<75 ns), transition (75–83 ns), and post-transition (>83 ns) time interval of the T0 simulation are colored in gray, cyan, and red, respectively. The representative crystallographic structures of HbA (black circles) and HbTn (black triangles) are also reported. TnB is not reported in panels (a) and (b) as the C-terminal residue of the β-chains (His146) is missing.

Similar articles

Cited by

References

    1. Brunori M. Hemoglobin is an honorary enzyme. Trends Biochem. Sci. 1999, 24, 158–161. 10.1016/S0968-0004(99)01380-8. - DOI - PubMed
    1. Perutz M. F.; Wilkinson A. J.; Paoli M.; Dodson G. G. The stereochemical mechanism of the cooperative effects in hemoglobin revisited. Annu. Rev. Biophys. Biomol. Struct. 1998, 27, 1–34. 10.1146/annurev.biophys.27.1.1. - DOI - PubMed
    1. Monod J.; Wyman J.; Changeux J. P. On the Nature of Allosteric Transitions: A Plausible Model. J. Mol. Biol. 1965, 12, 88–118. 10.1016/S0022-2836(65)80285-6. - DOI - PubMed
    1. Bellelli A.; Brunori M. Control of Oxygen Affinity in Mammalian Hemoglobins: Implications for a System Biology Description of the Respiratory Properties of the Red Blood Cell. Curr. Protein Pept. Sci. 2020, 21, 553–572. 10.2174/1389203721666200203151414. - DOI - PubMed
    1. Shibayama N. Allosteric transitions in hemoglobin revisited. Biochim. Biophys. Acta, Gen. Subj. 2020, 1864, 12933510.1016/j.bbagen.2019.03.021. - DOI - PubMed