. 2022 Jan 6;59(1):2004532.
doi: 10.1183/13993003.04532-2020. Print 2022 Jan.

Host lipidome and tuberculosis treatment failure

Affiliations

Host lipidome and tuberculosis treatment failure

Rupak Shivakoti et al. Eur Respir J. .

Abstract

Introduction: Host lipids play important roles in tuberculosis (TB) pathogenesis. Whether host lipids at TB treatment initiation (baseline) affect subsequent treatment outcomes has not been well characterised. We used unbiased lipidomics to study the prospective association of host lipids with TB treatment failure.

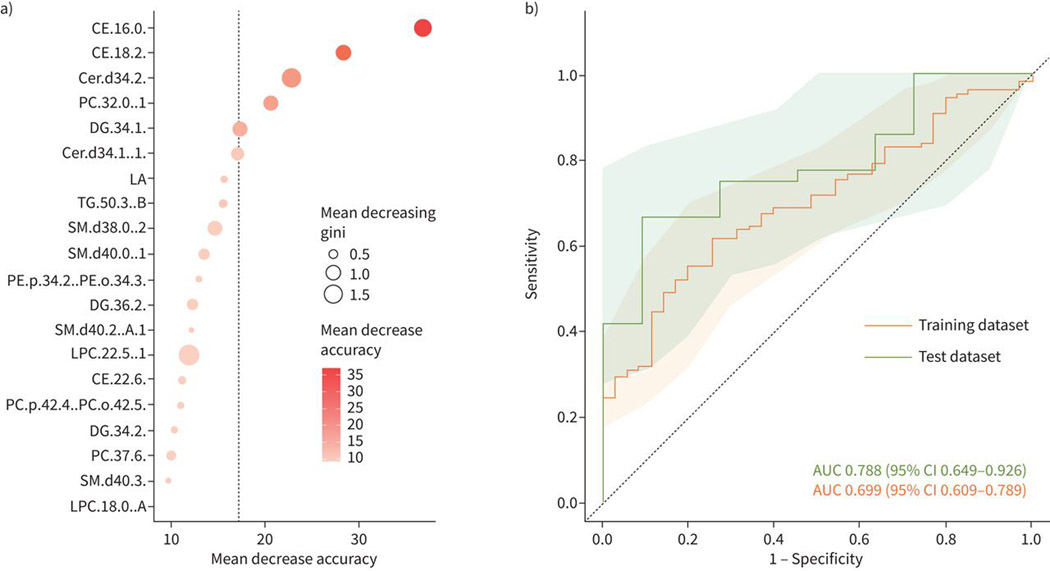
Methods: A case-control study (n=192), nested within a prospective cohort study, was used to investigate the association of baseline plasma lipids with TB treatment failure among adults with pulmonary TB. Cases (n=46) were defined as TB treatment failure, while controls (n=146) were those without failure. Complex lipids and inflammatory lipid mediators were measured using liquid chromatography mass spectrometry techniques. Adjusted least-square regression was used to assess differences in groups. In addition, machine learning identified lipids with highest area under the curve (AUC) to classify cases and controls.

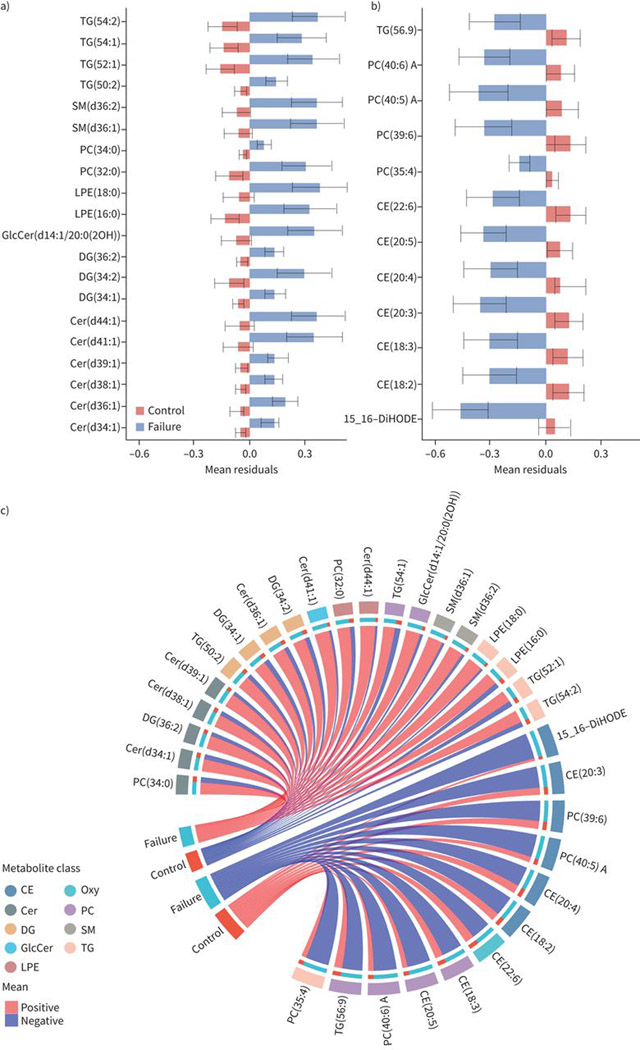
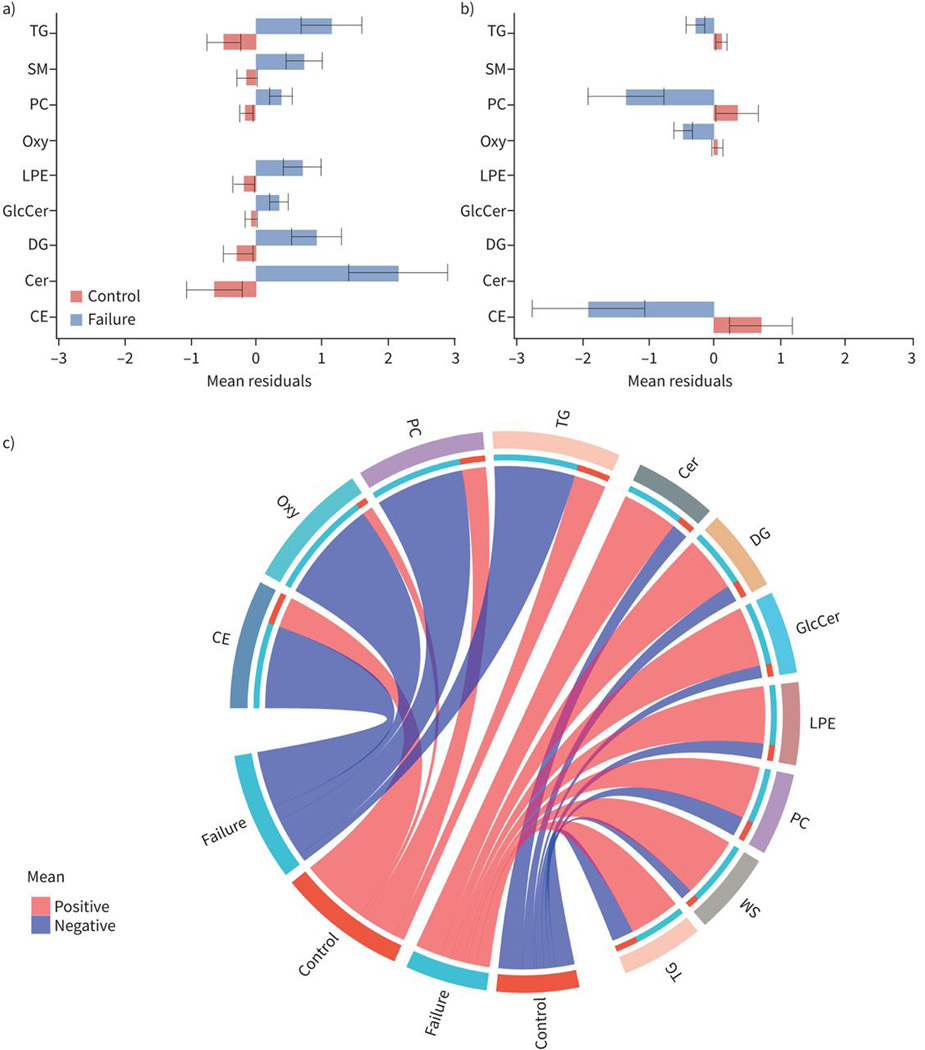
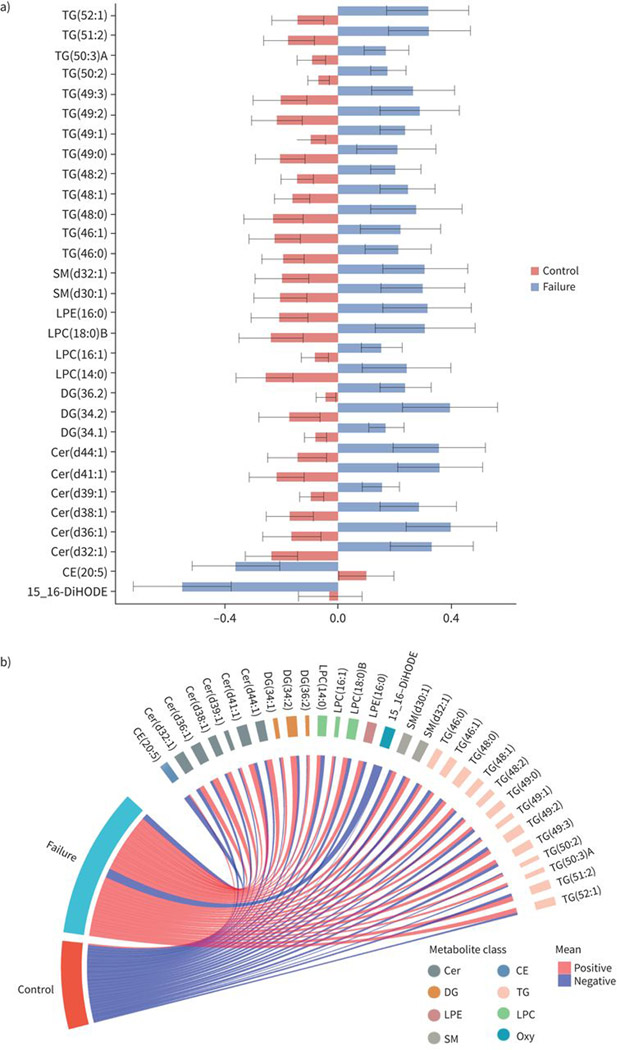
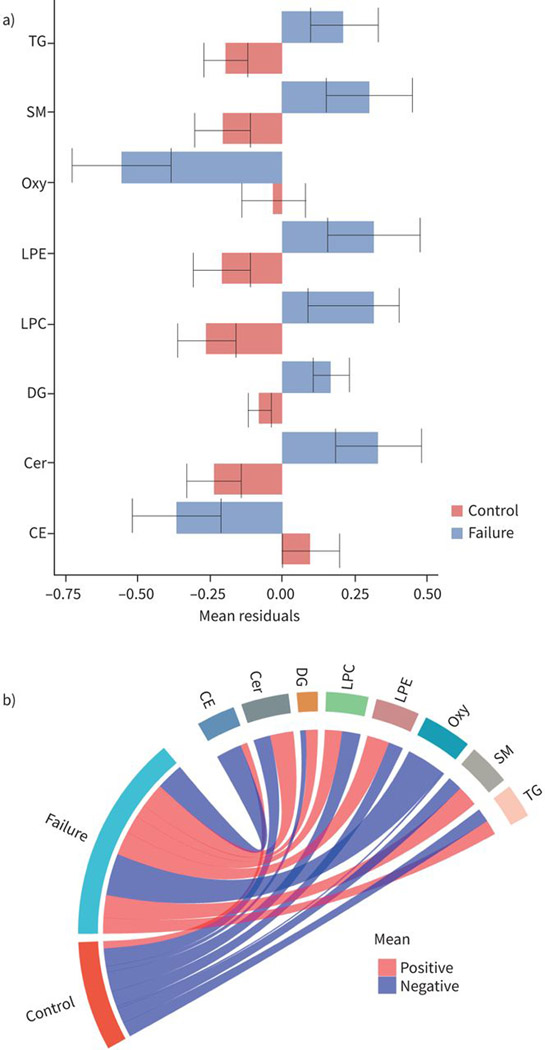
Results: Baseline levels of 32 lipids differed between controls and those with treatment failure after false discovery rate adjustment. Treatment failure was associated with lower baseline levels of cholesteryl esters and oxylipin, and higher baseline levels of ceramides and triglycerides compared to controls. Two cholesteryl ester lipids combined in a unique classifier model provided an AUC of 0.79 (95% CI 0.65-0.93) in the test dataset for prediction of TB treatment failure.

Conclusions: We identified lipids, some with known roles in TB pathogenesis, associated with TB treatment failure. In addition, a lipid signature with prognostic accuracy for TB treatment failure was identified. These lipids could be potential targets for risk-stratification, adjunct therapy and treatment monitoring.


Conflict of interest statement

Conflict of interest: R. Shivakoti reports grants from NIH, during the conduct of the study. Conflict of interest: J.W. Newman has nothing to disclose. Conflict of interest: L.E. Hanna has nothing to disclose. Conflict of interest: A.T.L. Queiroz has nothing to disclose. Conflict of interest: K. Borkowski has nothing to disclose. Conflict of interest: A.N. Gupte has nothing to disclose. Conflict of interest: M. Paradkar has nothing to disclose. Conflict of interest: P. Satyamurthi has nothing to disclose. Conflict of interest: V. Kulkarni has nothing to disclose. Conflict of interest: M. Selva has nothing to disclose. Conflict of interest: N. Pradhan has nothing to disclose. Conflict of interest: S.V.B.Y. Shivakumar has nothing to disclose. Conflict of interest: S. Natarajan has nothing to disclose. Conflict of interest: R. Karunaianantham has nothing to disclose. Conflict of interest: N. Gupte has nothing to disclose. Conflict of interest: K. Thiruvengadam has nothing to disclose. Conflict of interest: O. Fiehn has nothing to disclose. Conflict of interest: R. Bharadwaj has nothing to disclose. Conflict of interest: A. Kagal has nothing to disclose. Conflict of interest: S. Gaikwad has nothing to disclose. Conflict of interest: S. Sangle has nothing to disclose. Conflict of interest: J.E. Golub has nothing to disclose. Conflict of interest: B.B. Andrade has nothing to disclose. Conflict of interest: V. Mave reports grants from NIH, during the conduct of the study. Conflict of interest: A. Gupta reports grants from NIH, during the conduct of the study. Conflict of interest: C. Padmapriyadarsini has nothing to disclose.

Figures

FIGURE 1
FIGURE 1
Baseline levels of individual lipids associated with tuberculosis treatment failure. Barplots showing average baseline levels of mean±SE of residuals for individual lipids that are significantly a) higher or b) lower in treatment failure compared to controls. The x-axes show the mean residuals after adjusting for body mass index, age, study site, sex, diabetes, alcohol, smoking and HIV status. Differences are considered significant if their false discovery rate-adjusted p-values <0.05. c) Circular plots showing the individual lipids and the lipid families that are increased or decreased at baseline among failures compared to controls. TG: triacylglycerol; SM: sphingomyelin; PC: phosphatidylcholine; LPE: lyso-phosphatidylethanolamine; GlcCer: glycospingolipid; DG: diacylglycerol; Cer: ceramides; CE: cholesterol esters; DiHODE: dihydroxyoctadecadienoic acid; Oxy: oxylipins.
FIGURE 2
FIGURE 2
Baseline levels of lipid families associated with tuberculosis treatment failure. Barplots showing baseline levels of mean and standard errors of residuals for lipid families that are significantly a) higher or b) lower in treatment failure compared to controls. The x-axes show the mean residuals (sum of residuals of each individual lipid in the lipid family) after adjusting for body mass index, age, study site, sex, diabetes, alcohol, smoking and HIV status. Differences are considered significant if their false discovery rate-adjusted p-values <0.05. c) Circular plots showing the lipid families that are increased or decreased at baseline among failures compared to controls. TG: triacylglycerol; SM: sphingomyelin; PC: phosphatidylcholine; Oxy: oxylipins; LPE: lyso-phosphatidylethanolamine; GlcCer: glycospingolipid; DG: diacylglycerol; Cer: ceramides; CE: cholesterol esters.
FIGURE 3
FIGURE 3
Accuracy of prediction model. a) The dot plot shows the mean decrease accuracy and mean decreasing gini values from the random forest analysis to classify treatment failure and controls (cures). b) The lipids from the random forest model are evaluated by receiver operating characteristic curve. The area under the curve (AUC) for the training and test datasets are shown and the shaded area shows the confidence intervals of the AUCs.
FIGURE 4
FIGURE 4
Baseline levels of lipids associated with tuberculosis (TB) treatment failure in subset analysis. Barplots showing average baseline levels of mean and standard error of residuals for individual lipids that are significantly a) higher or b) lower in treatment failure compared to controls in subset analysis. The subset analysis was limited to those with culture or Xpert-confirmed pulmonary TB diagnosis at baseline as well as culture-confirmed outcomes (failure or cure). The x-axis shows the mean residuals after adjusting for body mass index, age, study site, sex, diabetes, alcohol, smoking and HIV status. Differences are considered significant if their false discovery rate-adjusted p-values <0.05. c) Circular plots showing the individual lipids and the lipid families that are increased or decreased at baseline among failures compared to controls. TG: triacylglycerol; SM: sphingomyelin; LPE: lyso-phosphatidylethanolamine; LPC: lyso-phosphatidylcholine; DG: diacylglycerol; Cer: ceramide; DiHODE: dihydroxyoctadecadienoic acid; CE: cholesterol ester; Oxy: oxylipin.
FIGURE 5
FIGURE 5
Baseline levels of lipid families associated with tuberculosis (TB) treatment failure in subset analysis. Barplots showing baseline levels of mean and standard errors of residuals for lipid families that are significantly a) higher or b) lower in treatment failure compared to controls in subset analysis. The subset analysis was limited to those with culture or Xpert-confirmed pulmonary TB diagnosis at baseline as well as culture-confirmed outcomes (failure or cure). The x-axis shows the mean residuals (sum of residuals of each individual lipid in the lipid family) after adjusting for body mass index, age, study site, sex, diabetes, alcohol, smoking and HIV status. Differences are considered significant if their false discovery rate-adjusted p-values <0.05. c) Circular plots showing the lipids families that are increased or decreased at baseline among failures compared to controls. TG: triacylglycerol; SM: sphingomyelin; Oxy: oxylipin; LPE: lyso-phosphatidylethanolamine; LPC: lyso-phosphatidylcholine; DG: diacylglycerol; Cer: ceramide; CE: cholesterol ester.

References

    1. Berry MP, Graham CM, McNab FW, et al. An interferon-inducible neutrophil-driven blood transcriptional signature in human tuberculosis. Nature 2010; 466: 973–977. - PMC - PubMed
    1. Cliff JM, Kaufmann SH, McShane H, et al. The human immune response to tuberculosis and its treatment: a view from the blood. Immunol Rev 2015; 264: 88–102. - PMC - PubMed
    1. Gupta RK, Turner CT, Venturini C, et al. Concise whole blood transcriptional signatures for incipient tuberculosis: a systematic review and patient-level pooled meta-analysis. Lancet Respir Med 2020; 8: 395–406. - PMC - PubMed
    1. Feng S, Du YQ, Zhang L, et al. Analysis of serum metabolic profile by ultra-performance liquid chromatography-mass spectrometry for biomarkers discovery: application in a pilot study to discriminate patients with tuberculosis. Chin Med J 2015; 128: 159–168. - PMC - PubMed
    1. Weiner J 3rd, Parida SK, Maertzdorf J, et al. Biomarkers of inflammation, immunosuppression and stress with active disease are revealed by metabolomic profiling of tuberculosis patients. PloS One 2012; 7: e40221. - PMC - PubMed

Publication types