. 2021 Sep 8;6(17):e144575.
doi: 10.1172/jci.insight.144575.

Hedgehog interacting protein-expressing lung fibroblasts suppress lymphocytic inflammation in mice

Affiliations

Hedgehog interacting protein-expressing lung fibroblasts suppress lymphocytic inflammation in mice

Jeong H Yun et al. JCI Insight. .

Abstract

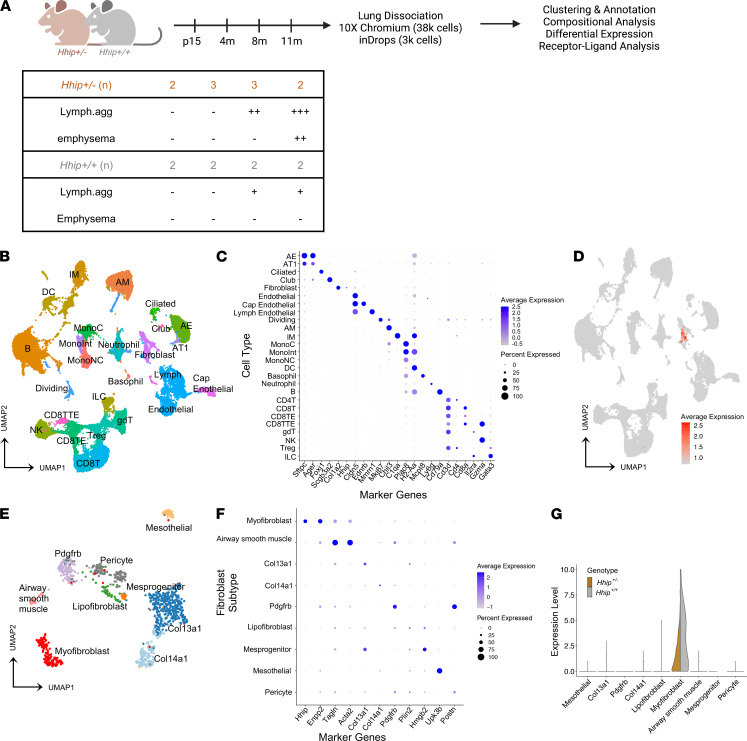
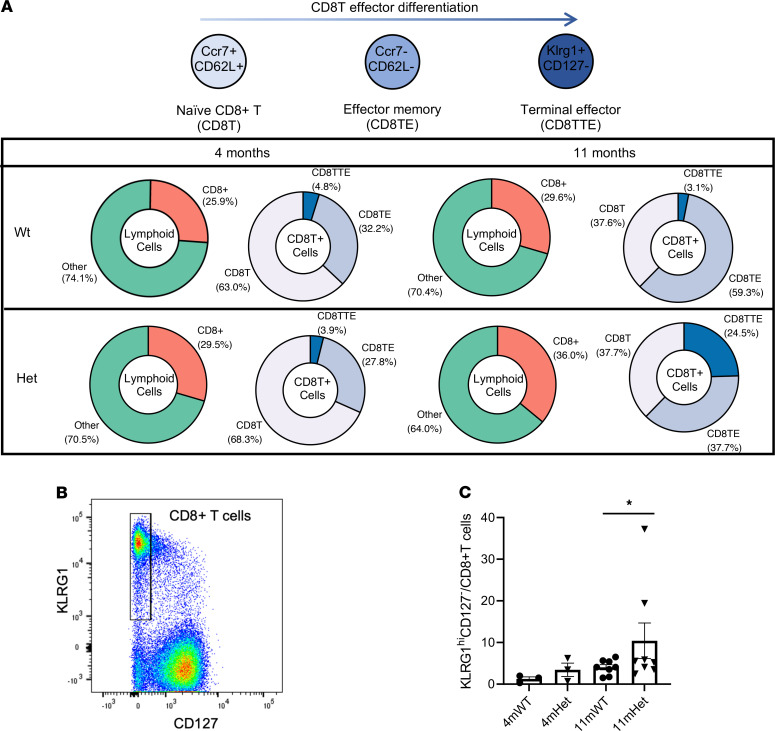
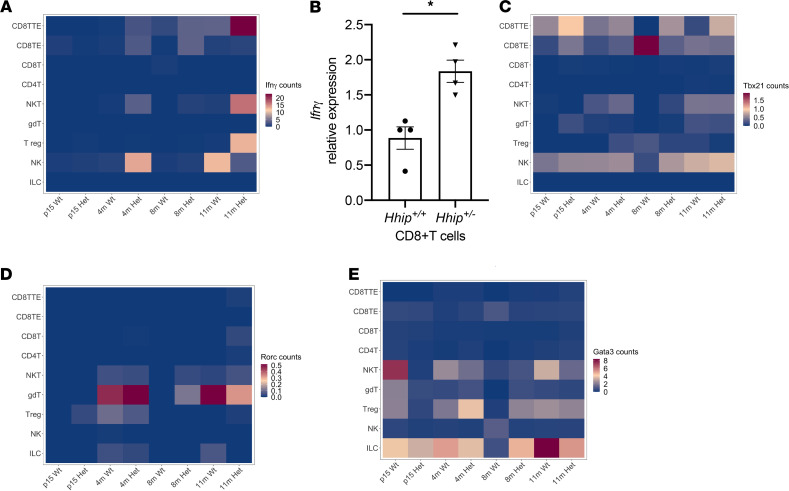
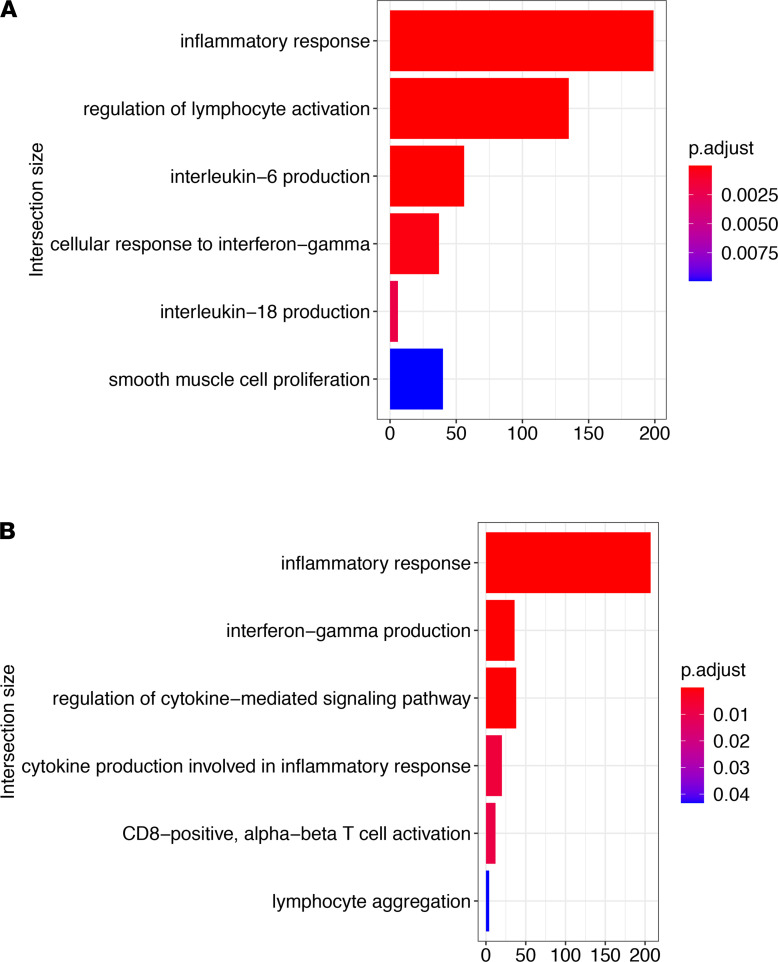
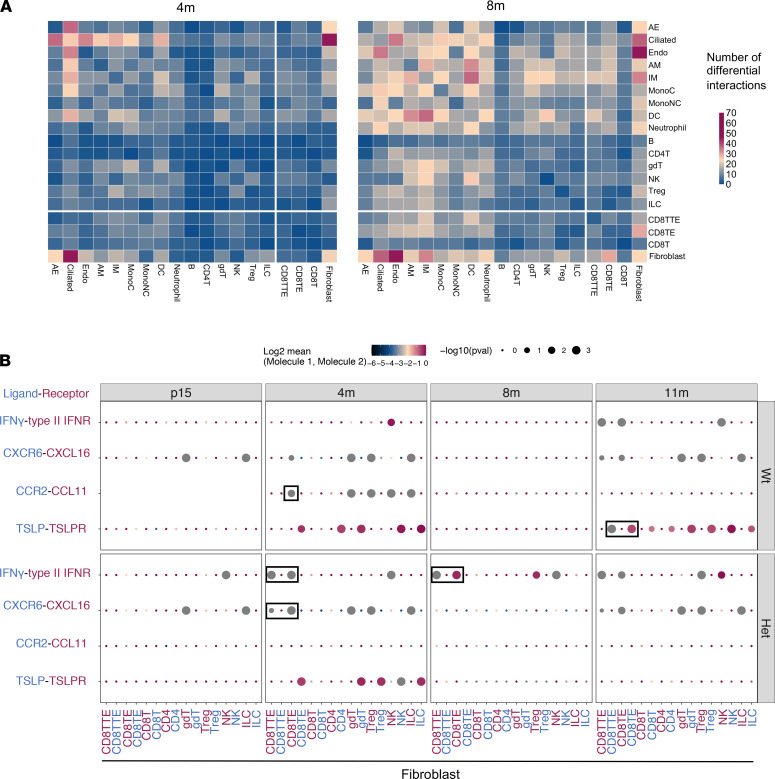
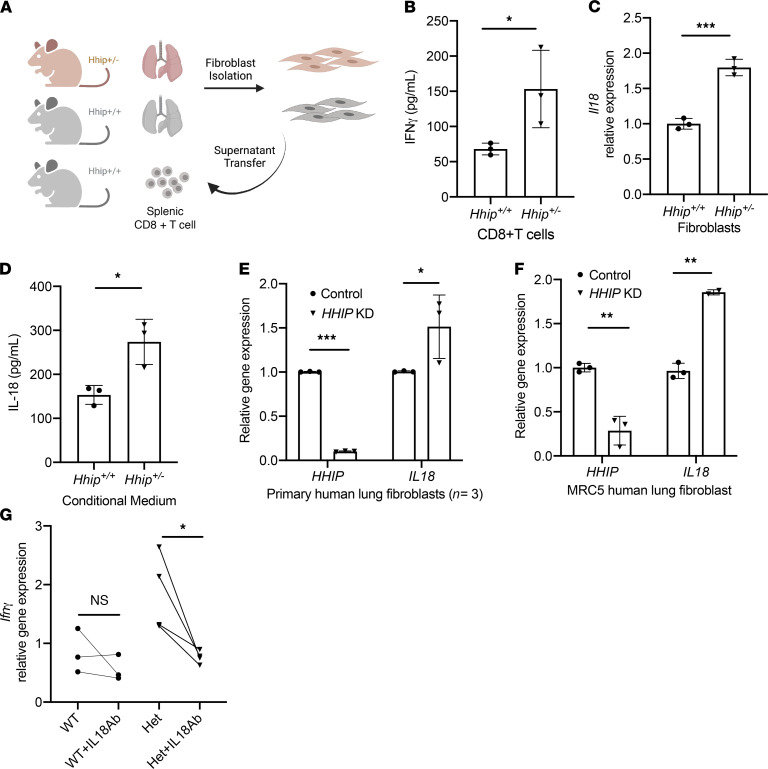
Chronic obstructive pulmonary disease (COPD) is mainly caused by cigarette smoking and characterized by chronic inflammation in vulnerable individuals. However, it is unknown how genetic factors may shape chronic inflammation in COPD. To understand how hedgehog interacting protein, encoded by HHIP gene identified in the genome-wide association study in COPD, plays a role in inflammation, we utilized Hhip+/- mice that present persistent inflammation and emphysema upon aging similar to that observed in human COPD. By performing single-cell RNA sequencing of the whole lung from mice at different ages, we found that Hhip+/- mice developed a cytotoxic immune response with a specific increase in killer cell lectin-like receptor G1-positive CD8+ T cells with upregulated Ifnγ expression recapitulating human COPD. Hhip expression was restricted to a lung fibroblast subpopulation that had increased interaction with CD8+ T lymphocytes in Hhip+/- compared with Hhip+/+ during aging. Hhip-expressing lung fibroblasts had upregulated IL-18 pathway genes in Hhip+/- lung fibroblasts, which was sufficient to drive increased levels of IFN-γ in CD8+ T cells ex vivo. Our finding provides insight into how a common genetic variation contributes to the amplified lymphocytic inflammation in COPD.

Trial registration: ClinicalTrials.gov NCT00608764.

Keywords: COPD; Inflammation; Mouse models; Pulmonology.


Figures

Figure 1
Figure 1. Single-cell RNA sequencing of Hhip+/– and Hhip+/+ murine lungs.
(A) Experimental design of lung single-cell RNA sequencing from age-matched Hhip+/– and WT littermate Hhip+/+ mice. (B) Unbiased clustering of 38,875 cells from 26 clusters by uniform manifold approximation and projection (UMAP) plot. (C) Expression of representative marker genes across cell type clusters. (D) UMAP plot indicating fibroblast cluster expressing Hhip (red dots). (E) Nine subclusters of lung fibroblasts showing heterogeneity. (F) Expression of representative fibroblast subcluster marker genes shown in dot plot. Hhip is a marker gene for myofibroblast subcluster. (G) Hhip expression is decreased in Hhip+/– lungs. Expression values are normalized unique molecular identifier (UMI) count. Lymph.agg, lymphoid aggregates; AE: alveolar epithelial cell; AT1, type 1 alveolar epithelial cell; Cap Endothelial, capillary endothelial cell; Lymph Endothelial, lymphatic endothelial cell; AM, alveolar macrophage; IM, interstitial macrophage; Mesprogenitor: mesenchymal progenitor; MonoC, classical monocyte; MonoInt, intermediate monocyte; MonoNC, nonclassical monocyte; DC, dendritic cell; CD8TE, CD8+ effector memory T cell; CD8TTE, CD8+ terminal effector T cell; gdT, γδ T cell; NK, natural killer cell; Treg, regulatory T cell; ILC, innate lymphoid cell.
Figure 2
Figure 2. Number of CDTTEs increased in Hhip+/– mice with age.
(A) Naive CD8+ T cells (Ccr7+CD62L+) differentiate into terminal effector cells (Klrg1+CD127). Proportion of CD8+ T cells including naive CD8+ T (CD8T) cells, effector memory CD8+ T cells (CD8TE), and terminal effector CD8+ T cells (CD8TTE) increases with age in Hhip+/– (Het) mice. (B) FACS gating strategy for CD8TTE cells. CD8+ T cells were gated for KLRG1hiCD127 populations. (C) Proportion of CD8TTEs in total CD8+ T cells. Each point represents an individual biological replicate. Error bars indicate standard error of the mean (SEM). *P < 0.05. Wilcoxon matched pairs (by age- and sex-matched littermates) signed rank test.
Figure 3
Figure 3. Increased activation of CDTTEs in Hhip+/– mice.
(A) Average expression (normalized UMI count) of Ifnγ in various lymphocyte subtypes showing terminal effector CD8+ T (CD8TTE) cells with increased Ifnγ expression in Hhip+/– mice. (B) Ifnγ expression is increased in Hhip+/– lung CD8+ T cells as measured by qPCR (n = 4 mice/group, 4 months of age). Error bars indicate SEM. (C) Average expression of Tbx21 in various lymphocytes showing CD8TTE cells with increased Tbx21 expression in Hhip+/– mice. (D) Average expression of Rorc in various lymphocyte subtypes. (E) Average expression of Gata3 in various lymphocytes with enrichment in Tregs, NKT cells, and ILCs. *P < 0.05, unpaired Student’s t test. CD8TTE, CD8+ terminal effector T cell; CD8TE, CD8+ effector memory T cell; CD8T, CD8+ naive T cell; CD4T, CD4+ T cell; NKT, natural killer T cell; gdT, γδ T cell; Treg, regulatory T cell; NK, natural killer cell; ILC, innate lymphoid cell.
Figure 4
Figure 4. Inflammatory response–related pathways are enriched in Hhip+/– CD8+ T cells and fibroblasts.
Selected pathways that are significantly enriched with upregulated genes in Hhip+/– compared with Hhip+/+ mice by Gene Ontology (GO) analysis in (A) all CD8+ T cells and (B) fibroblasts. Pathway analysis was performed with gprofiler2. P value is FDR adjusted.
Figure 5
Figure 5. Receptor-ligand analysis suggests dysregulated fibroblast-T cell interaction in lungs from Hhip-haploinsufficient mice.
(A) Genotype-dependent differential receptor-ligand interactions across various cell types from mice at 4 months (4m) and 8 months (8m) of age. Color scale bar indicates number of interaction pairs between cell types. (B) Selected ligand (blue)-receptor (pink) pairs between fibroblasts and immune cells from mice at different age points. Select receptor-ligand interaction pairs that are different by genotype are marked by black rectangles. Dot size indicates P values and the means of expression levels (normalized UMI counts) of interacting molecules are indicated by color of each dot. Wt, Hhip+/+; Het, Hhip+/–; AE, alveolar epithelial cell; Endo, endothelial cell; AM, alveolar macrophage; IM, interstitial macrophage; MonoC, classical monocyte; MonoNC, nonclasscial monocyte; DC, dendritic cell; B, B cell; CD8T, CD8+ naive T cell; CD8TE, CD8+ effector memory T cell; CD8TTE, CD8+ terminal effector T cell; gdT, γδ T cell; NK, natural killer cell; Treg, regulatory T cell; ILC, innate lymphoid cell.
Figure 6
Figure 6. Hhip+/– lung fibroblasts induce increased IFN-γ production from CD8+ T cells.
(A) Experimental design. Splenic CD8+ T cells from Hhip+/+ mice were treated with conditioned medium (CM) from lung fibroblasts from 11-month-old Hhip+/+ and Hhip+/– mice for 24 hours. (B) WT CD8+ T cells incubated with Hhip+/–-derived CM produced increased levels of IFN-γ. (C) Lung fibroblasts from Hhip+/– mice have higher expression of Il18. (D) IL-18 level is elevated in the Hhip+/–-derived CM measured by ELISA. (E) Knockdown of HHIP by siRNA in adult primary human lung fibroblasts (n = 3) and (F) human fetal lung fibroblast cell line MRC5 led to increased expression of Il18. (G) Expression of Ifnγ in WT splenic CD8+ T cells treated with conditioned medium derived from Hhip+/+ or Hhip+/ fibroblasts for 24 hours, with or without IL-18 neutralizing Ab (30 μg/mL) as measured by qPCR with Cd8a as the reference gene. Each point represents an individual biological replicate. Data are represented as mean ± SD, with n ≥ 3 per group. *P < 0.05, **P < 0.01, ***P < 0.001, unpaired Student’s t test (BF), paired Student’s t test (G). Representative results are shown (from ≥2 replicated experiments with 2–4 mice in each repeat for BD and F). KD, knockdown.

Similar articles

Cited by

References

    1. Lutz SM, et al. A genome-wide association study identifies risk loci for spirometric measures among smokers of European and African ancestry. BMC Genet. 2015;16(1):138. doi: 10.1186/s12863-015-0299-4. - DOI - PMC - PubMed
    1. Cho MH, et al. Risk loci for chronic obstructive pulmonary disease: a genome-wide association study and meta-analysis. Lancet Respir Med. 2014;2(3):214–225. doi: 10.1016/S2213-2600(14)70002-5. - DOI - PMC - PubMed
    1. Hobbs BD, et al. Genetic loci associated with chronic obstructive pulmonary disease overlap with loci for lung function and pulmonary fibrosis. Nat Genet. 2017;49(3):426–432. doi: 10.1038/ng.3752. - DOI - PMC - PubMed
    1. Pillai SG, et al. A genome-wide association study in chronic obstructive pulmonary disease (COPD): identification of two major susceptibility loci. PLoS Genet. 2009;5(3):e1000421. doi: 10.1371/journal.pgen.1000421. - DOI - PMC - PubMed
    1. Cho MH, et al. A genome-wide association study of emphysema and airway quantitative imaging phenotypes. Am J Respir Crit Care Med. 2015;192(5):559–569. doi: 10.1164/rccm.201501-0148OC. - DOI - PMC - PubMed

Publication types

MeSH terms

Associated data