. 2021 Aug 19;81(16):3368-3385.e9.
doi: 10.1016/j.molcel.2021.07.024. Epub 2021 Aug 9.

Enhancer RNA m6A methylation facilitates transcriptional condensate formation and gene activation

Affiliations

Enhancer RNA m6A methylation facilitates transcriptional condensate formation and gene activation

Joo-Hyung Lee et al. Mol Cell. .

Abstract

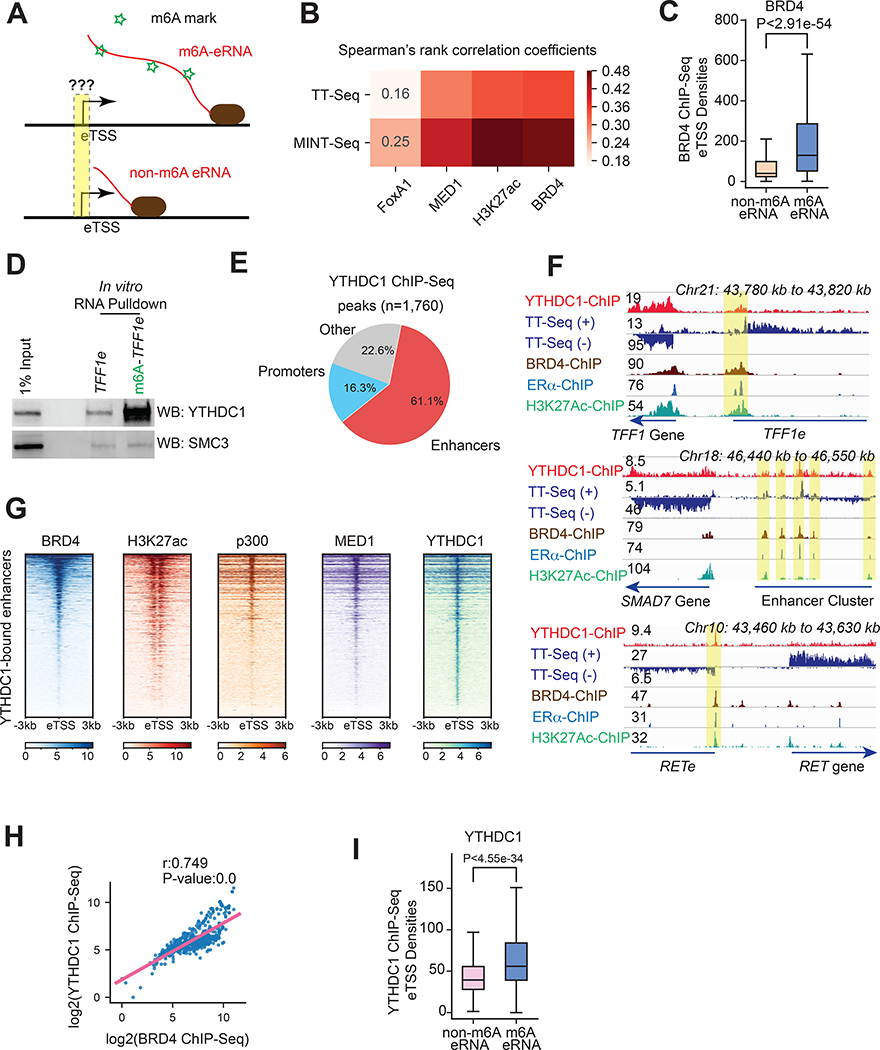
The mechanistic understanding of nascent RNAs in transcriptional control remains limited. Here, by a high sensitivity method methylation-inscribed nascent transcripts sequencing (MINT-seq), we characterized the landscapes of N6-methyladenosine (m6A) on nascent RNAs. We uncover heavy but selective m6A deposition on nascent RNAs produced by transcription regulatory elements, including promoter upstream antisense RNAs and enhancer RNAs (eRNAs), which positively correlates with their length, inclusion of m6A motif, and RNA abundances. m6A-eRNAs mark highly active enhancers, where they recruit nuclear m6A reader YTHDC1 to phase separate into liquid-like condensates, in a manner dependent on its C terminus intrinsically disordered region and arginine residues. The m6A-eRNA/YTHDC1 condensate co-mixes with and facilitates the formation of BRD4 coactivator condensate. Consequently, YTHDC1 depletion diminished BRD4 condensate and its recruitment to enhancers, resulting in inhibited enhancer and gene activation. We propose that chemical modifications of eRNAs together with reader proteins play broad roles in enhancer activation and gene transcriptional control.

Keywords: BRD4; MINT-Seq; RNA m6A methylation; YTHDC1; enhancer RNAs; enhancers; epitranscriptome; nuclear condensate; phase separation; transcriptional activation.


Conflict of interest statement

Declaration of interests The authors declare no competing interests.

Figures

Figure 1.
Figure 1.. A high-sensitivity map of m6A methylome on nascent eRNAs.
(A) A venn diagram showing m6A peaks detected by MINT-Seq/MeRIP-Seq in MCF7 cells. (B) Pie charts depicting the percentage of putative enhancers marked by p300 (upper) or BRD4 (bottom) that have m6A peaks in their 5kb vicinity. (C) A snapshot of TT-Seq, MINT-Seq, m6A methylation ratio (MMR), and ChIP-Seq at the TFF1 locus in MCF7 cells. The yellow-highlight denotes the TFF1 enhancer center, and orange arrowheads denote MINT-Seq peaks. Two arrows below show the transcription direction of the gene and the eRNA. (−): Crick strand, (+): Watson strand. (D) Boxplots showing MMR of m6A-eRNAs, m6A-uaRNAs and m6A-pre-mRNAs. MMR was determined by the ratio of MINT-Seq/TT-Seq. (E) Heatmap and metagene (F) plots of MINT-Seq and TT-Seq reads densities over m6A-eRNAs. Rows of heatmaps were ranked by the relative position of MINT-Seq max values. Each individual eRNA was scaled to fit the plot. (G-K) Boxplots showing the features of non-m6A- and m6A-eRNAs: (G) transcript length, (H) RRACH motif count, (I) nascent transcripts abundance, (J) steady-state transcripts abundance, (K) relative stability. (L) A metagene plot showing the RRACH motif density over the 10kb genomic regions downstream of the eRNA TSSs (eTSS) of non-m6A-eRNAs or m6A-eRNAs. (M) A diagram illustrating different levels of m6A deposition to eRNAs of varied lengths. P-values in D,G-K: Mann-Whitney U test. See also Figures S1,S2,S3.
Figure 2.
Figure 2.. YTHDC1 binds active enhancers via m6A-marked eRNAs.
(A) A diagram showing levels of m6A on eRNA transcripts versus the epigenomic features of their eTSSs. Green stars indicated m6A marks. (B) A matrix heatmap showing Spearman’s Correlation Coefficients between TT-Seq or MINT-Seq RPKM over the entirety of eRNA transcripts and ChIP-Seq binding intensity over eTSS (+/− 3kb regions). (C) A boxplot of BRD4 ChIP-Seq densities on the eTSSs of non-m6A eRNAs (n = 1,676) or m6A-eRNAs (n = 531). P-value: Mann-Whitney U test. (D)In vitro biotinylated m6A or non-m6A eRNA pulldown followed by Western blotting with YTHDC1 and SMC3 antibodies. (E) A pie chart depicting genomic distribution of YTHDC1 ChIP-Seq peaks, which are largely located at enhancers. (F) Browser tracks of YTHDC1 ChIP-Seq as aligned to TT-Seq, BRD4, ERɑ and H3K27ac at multiple loci in MCF7 cells (with E2). YTHDC1 enriched enhancers were highlighted yellow. (G) Heatmaps showing the binding of BRD4, H3K27ac, p300, MED1 and YTHDC1 on the active enhancers with YTHDC1 binding (red group in E panel). (H) A correlation scatter plot between BRD4 and YTHDC1 ChIP-Seq intensities on enhancers that produce m6A-eRNAs (i.e. +/− 3kb eTSSs, n = 531). The coefficient (r) and P-value are calculated by Spearman’s Correlation. (I) A boxplot showing YTHDC1 ChIP-Seq intensity on the eTSSs of non-m6A eRNAs (n=1,676) v.s. m6A-eRNAs (n = 531). P-value: Mann-Whitney U test. See also Figures S4,S5,S6.
Figure 3.
Figure 3.. Direct roles of m6A-eRNA in recruiting YTHDC1 to active enhancers.
(A) A diagram of dCasRx mediated FTO tethering. (B) Western blot showing the CasRx-HA protein expression by an HA antibody. GAPDH was used as a loading control. (C) RT-qPCR showing relative expression of TFF1e in no Dox v.s. Dox (2μg/ml) treated CasRx-HA MCF7 cells expressing a specific gRNA targeting TFF1e RNA. (D) Western blots showing the expression of HA tagged dCasRx-FTO protein. (E) MeRIP qPCR results showing the m6A level of TFF1e RNA after dCasRx-FTO meditated m6A editing. GREB1e was used as control. (F) UV RIP-qPCR showing the binding of YTHDC1 on TFF1e RNA after dCasRx-FTO m6A editing. (G) A diagram showing the strategy to use an inhibitor to perturb the binding between YTHDC1 and m6A RNAs. The chemical structure of Compound 11 is shown. (H) UV RIP-qPCR showing the binding of YTHDC1 on two eRNAs after treatment by Compound 11. (I) Western blot using indicated antibodies after 6hrs of treatment by the YTHDC1 inhibitor. qPCR data represents mean +/− SD of n=3 biological replicates. P values: Student’s T-tests. **, p < 0.01; ***<0.001. N.S: not significant. See alsoFigures S5,S6, S8.
Figure 4.
Figure 4.. YTHDC1/m6A-eRNA stimulate enhancer activation and a broad gene transcriptional program.
(A) Western blots showing the protein levels of YTHDC1 in the rescue experiments (the same sets as in panel B). WA/WA: W377A/W428A double mutant. (B) RT-qPCR of two eRNAs and a gene showing the knockdown effects by siYTHDC1, and their rescue by wildtype (WT) but not the WA/WA mutant. (C,E) Snapshots showing reduced levels of two eRNAs and their neighboring genes after YTHDC1 knockdown in GRO-Seq (C) and TT-Seq (E). (+)/(−) indicate Waston/Crick strands. (D,F) Boxplots depicting RPKM of GRO-Seq (D) and TT-Seq (F) of E2 induced eRNAs and genes in siCTL or siYTHDC1 treated MCF7 cells. P-values: Mann-Whitney U test. (G) YTHDC1 protein levels upon rapid PROTAC3 degradation. ERα, BRD4, METTL3 are also shown. (H) Effects after PROTAC3 degradation of YTHDC1 or conventional siYTHDC1 on the expression of TFF1e, SMAD7e and TFF1 gene in HaloTag-YTHDC1 MCF7 cells. qPCR data represents mean +/− SD of n=3 biological replicates. P values: Student’s T-tests. **, p < 0.01; ***<0.001. N.S: not significant. See also Figures S7,S8.
Figure 5.
Figure 5.. YTHDC1/m6A-eRNAs form liquid-like nuclear condensates.
(A) (Left) Numbers of amino acids (aa) of YTHDC1 domains, including the two predicted intrinsic disordered regions (IDR) flanking the YTH domain. Lower part shows disordered propensity by the PONDR VSL2 tool (1.0 indicates highly disordered). To the right, a diagram depicts the YTHDC1 binding to a m6A mark (green star). (B) Representative images from Optodroplet assay of full length (FL) YTHDC1, its IDR1, YTH domain (YTH), IDR2 and its partial protein YTH-IDR2 in 293T cells, scale bars denote 5μm. Orange circles indicate light induced optodroplets, or lack of response for the IDR1 and YTH domain. (C) FRAP of endogenous mClover-YTHDC1 in MCF7 cells. 10 condensates were subjected to FRAP, and their mean +/− SD were plotted. A representative mClover-YTHDC1 condensate during FRAP is shown below. Scale bar: 5μm. Pre: pre-bleaching. (D)In vitro phase separation assay of 1μM mClover-YTH-IDR2, mClover-YTH domain or mClover-YTH-IDR2-R to A mutant, without RNA, with 1nM non-m6A-TFF1e, or with m6A-TFF1e RNAs. Scale bar: 10μm. (E) Quantification of the particle areas for each condition in panel D. (F, G) Representative images and quantitation of In vitro condensates of 0.5μM mClover-YTH-IDR2 without or with the addition of m6A-TFF1e at the indicated concentrations. Scale bar indicates 10 μm. P values in E and F panel: Student’s T tests. *: p <0.05, **: p <0.01, ***: p < 0.001, N.S: Not significant Data are representative of two independent experiments. See also Figures S9,S10.
Figure 6.
Figure 6.. YTHDC1/m6A-eRNAs interaction facilitates BRD4 condensate formation and its enhancer binding.
(A) Heatmaps showing BRD4 or H3K27ac ChIP-Seq signals on putative enhancers with or without YTHDC1. BRD4 antibody: Bethyl A301–985A100. (B) Western blots showing the expression levels of the knock-in mCherry-BRD4 (upper) and non-tagged BRD4 (bottom) in parental and knockin (KI) cells. GAPDH is a loading control. (C) Representative live cell images showing the endogenous mCherry-BRD4 condensates, and their reduction by siYTHDC1. Scale bars: 5μm. (Right) quantification of the foci number per cell. Data are representative of three independent experiments; n= cell numbers. (D)In vitro condensate assay showing the effect of m6A-TFF1e RNA supplement to the condensate co-assembly between mClover-YTH-IDR2 (0.5μM, green) and Alexa647-labeled BRD4 (1μM, purple). Scale bars: 5μm. m6A-TFF1e was labeled with Cy3-UTP (red). (E)In vitro phase separation of BRD4 in the absence or presence of mClover-YTH-IDR2-WT, -R to A mutant, the YTH domain only with or without m6A-marked TFF1e. For these, 1μM of BRD4, 1μM mClover-YTHDC1 proteins and 1nM m6A-marked TFF1e were used. Scale bar is 10μm. BRD4 was labeled by Alexa647 (purple color). Data are representative of two independent experiments. (F) Quantification of condensate sizes of BRD4 in panel E. See also Figures S10,S11.
Figure 7.
Figure 7.. A model for m6A-eRNAs and YTHDC1 that function in facilitating the formation of transcriptional condensates and enhancer/gene activation.
A diagram summarizing our findings in this work. These results provide a conceptual advance to understand the roles of nascent eRNAs and their chemical modifications in transcriptional control, paving ways for further studies of epitranscriptome-epigenome crosstalks. IDR: intrinsically disordered region.

References

    1. Akichika S, Hirano S, Shichino Y, Suzuki T, Nishimasu H, Ishitani R, Sugita A, Hirose Y, Iwasaki S, Nureki O, et al. (2019). Cap-specific terminal N (6)-methylation of RNA by an RNA polymerase II-associated methyltransferase. Science 363. - PubMed
    1. Alarcon CR, Goodarzi H, Lee H, Liu X, Tavazoie S, and Tavazoie SF (2015). HNRNPA2B1 Is a Mediator of m(6)A-Dependent Nuclear RNA Processing Events. Cell 162, 1299–1308. - PMC - PubMed
    1. Andersson R, Gebhard C, Miguel-Escalada I, Hoof I, Bornholdt J, Boyd M, Chen Y, Zhao X, Schmidl C, Suzuki T, et al. (2014). An atlas of active enhancers across human cell types and tissues. Nature 507, 455–461. - PMC - PubMed
    1. Arner E, Daub CO, Vitting-Seerup K, Andersson R, Lilje B, Drablos F, Lennartsson A, Ronnerblad M, Hrydziuszko O, Vitezic M, et al. (2015). Transcribed enhancers lead waves of coordinated transcription in transitioning mammalian cells. Science 347, 1010–1014. - PMC - PubMed
    1. Bahr C, von Paleske L, Uslu VV, Remeseiro S, Takayama N, Ng SW, Murison A, Langenfeld K, Petretich M, Scognamiglio R, et al. (2018). A Myc enhancer cluster regulates normal and leukaemic haematopoietic stem cell hierarchies. Nature 553, 515–520. - PubMed

Publication types

MeSH terms