. 2021 Sep;297(3):101049.
doi: 10.1016/j.jbc.2021.101049. Epub 2021 Aug 8.

Fused in sarcoma regulates DNA replication timing and kinetics

Affiliations

Fused in sarcoma regulates DNA replication timing and kinetics

Weiyan Jia et al. J Biol Chem. 2021 Sep.

Abstract

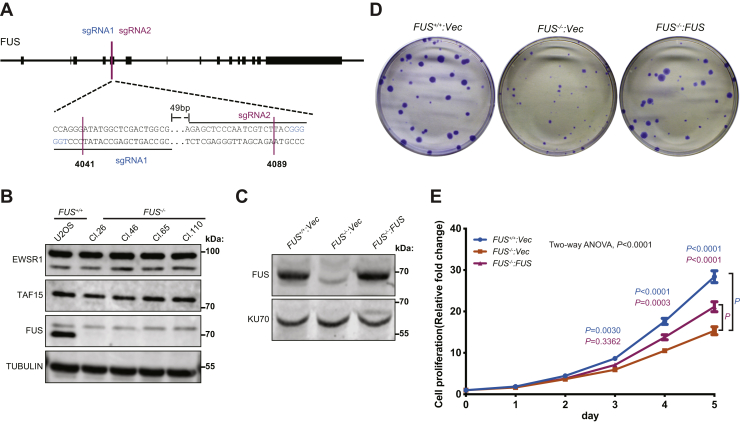
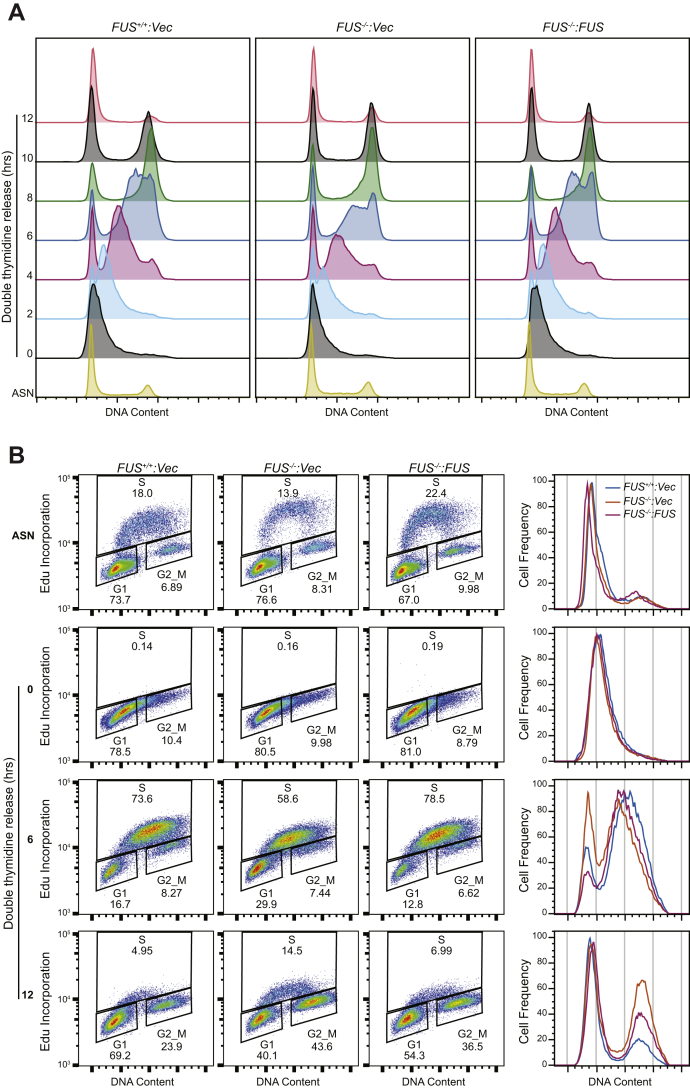
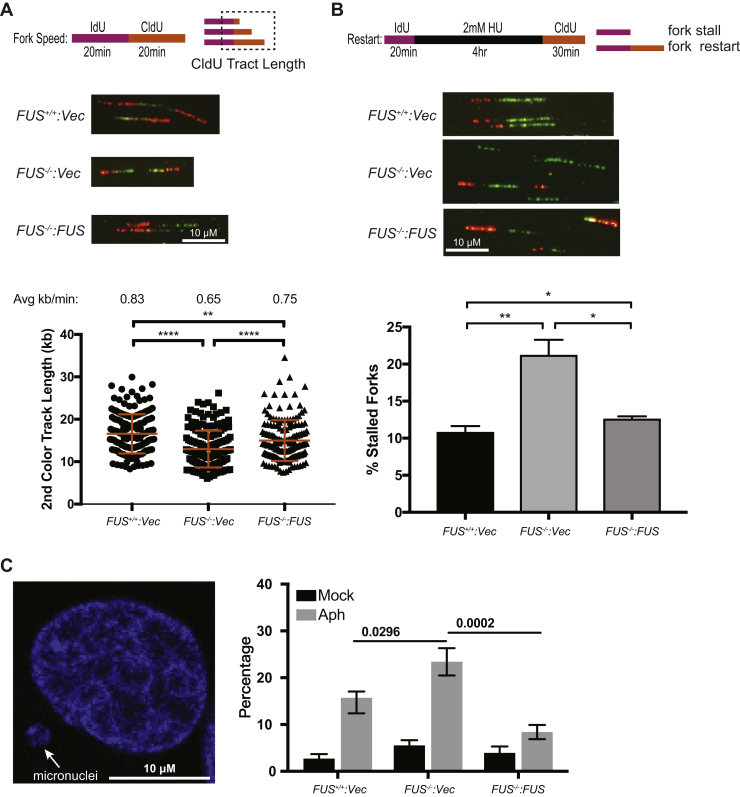
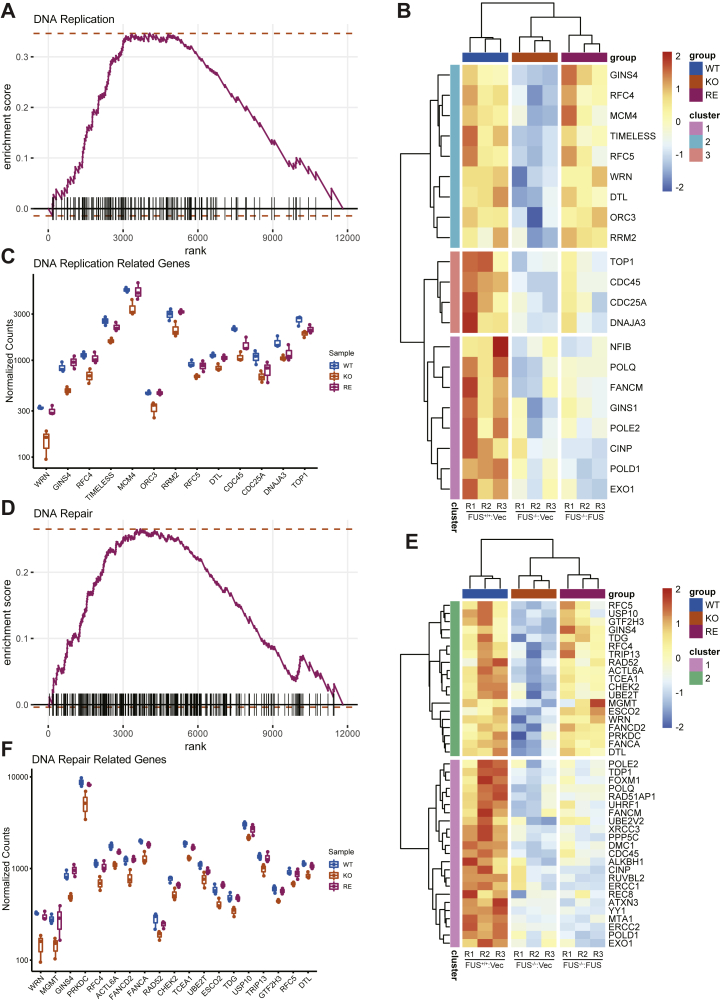
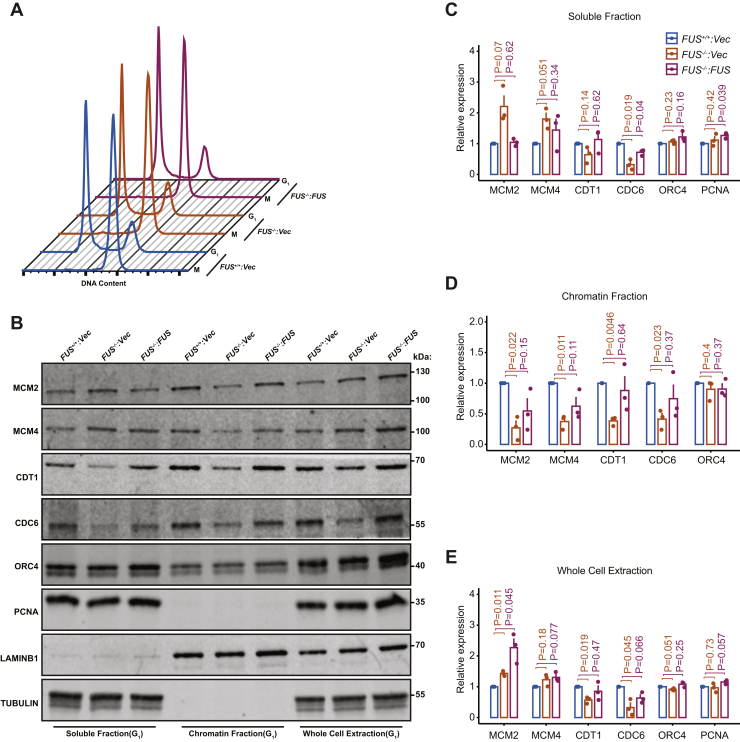
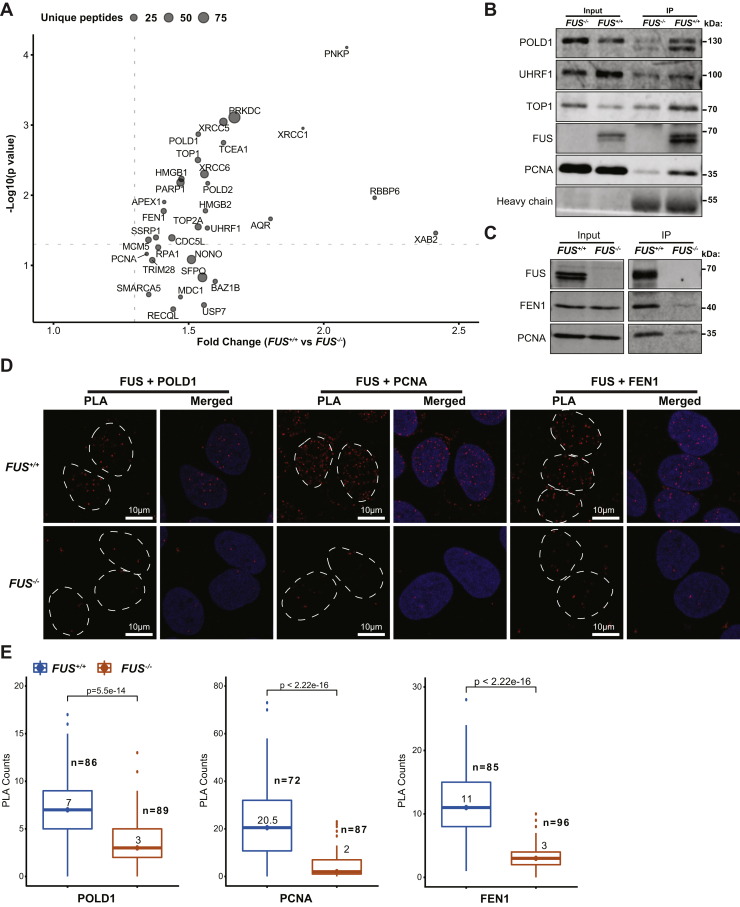
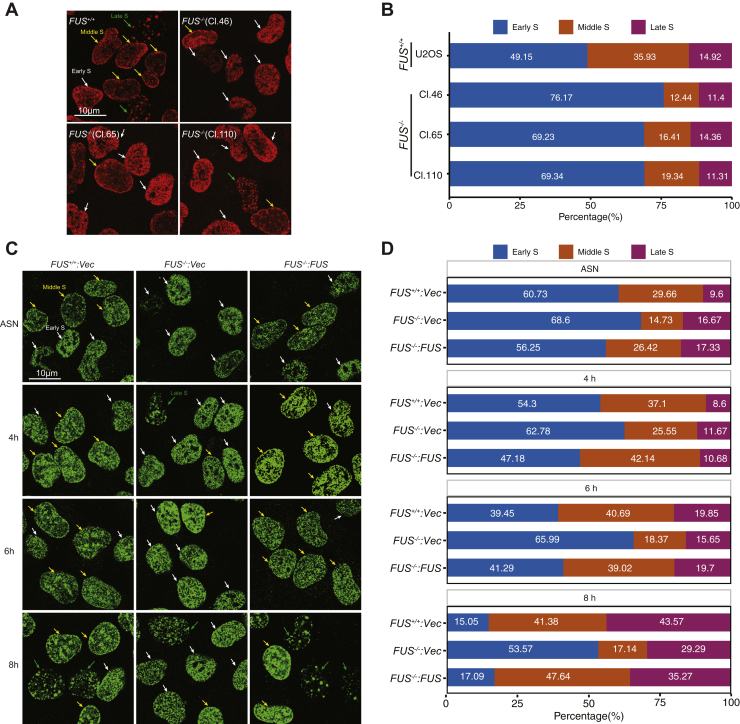
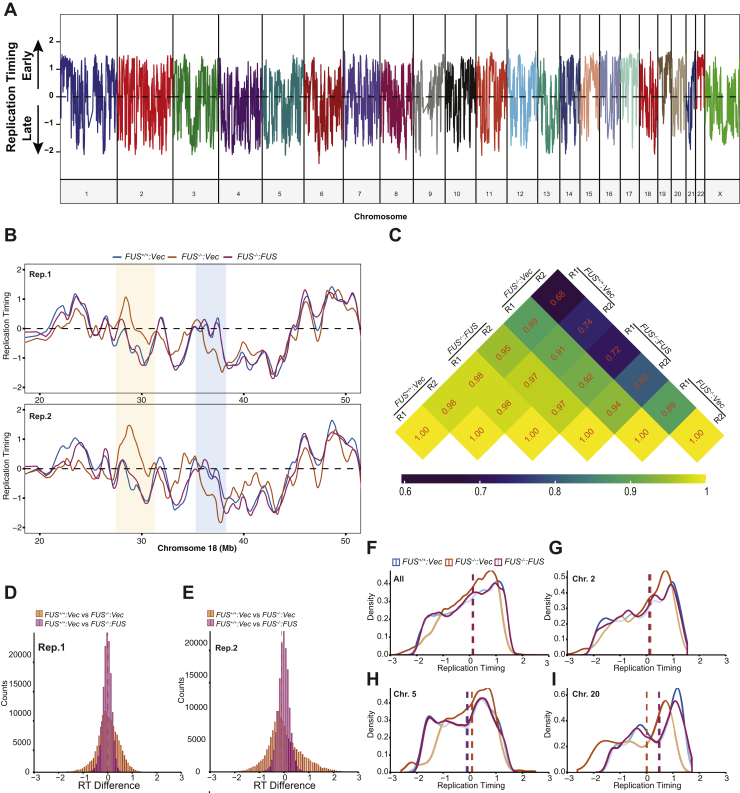
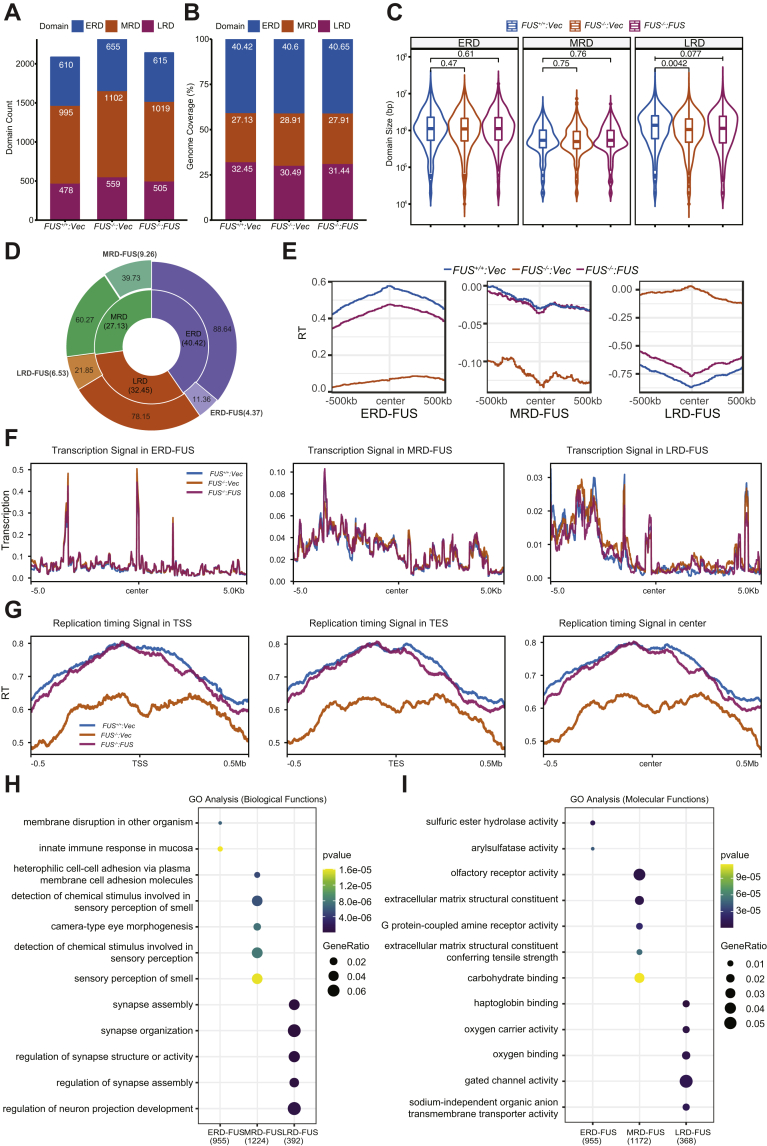
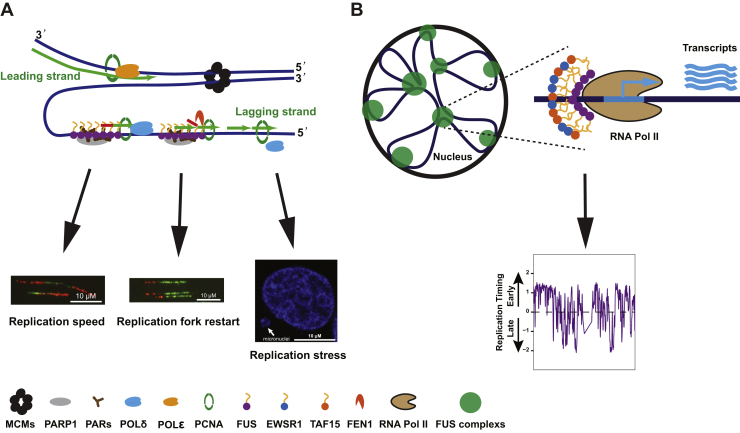
Fused in sarcoma (FUS) encodes an RNA-binding protein with diverse roles in transcriptional activation and RNA splicing. While oncogenic fusions of FUS and transcription factor DNA-binding domains are associated with soft tissue sarcomas, dominant mutations in FUS can cause amyotrophic lateral sclerosis. FUS has also been implicated in genome maintenance. However, the underlying mechanisms of its actions in genome stability are unknown. Here, we applied gene editing, functional reconstitution, and integrated proteomics and transcriptomics to illuminate roles for FUS in DNA replication and repair. Consistent with a supportive role in DNA double-strand break repair, FUS-deficient cells exhibited subtle alterations in the recruitment and retention of double-strand break-associated factors, including 53BP1 and BRCA1. FUS-/- cells also exhibited reduced proliferative potential that correlated with reduced speed of replication fork progression, diminished loading of prereplication complexes, enhanced micronucleus formation, and attenuated expression and splicing of S-phase-associated genes. Finally, FUS-deficient cells exhibited genome-wide alterations in DNA replication timing that were reversed upon re-expression of FUS complementary DNA. We also showed that FUS-dependent replication domains were enriched in transcriptionally active chromatin and that FUS was required for the timely replication of transcriptionally active DNA. These findings suggest that alterations in DNA replication kinetics and programming contribute to genome instability and functional defects in FUS-deficient cells.

Keywords: DNA repair; DNA replication; RNA binding protein; amyotrophic lateral sclerosis (ALS); fused in sarcoma (FUS); replication timing.


Conflict of interest statement

Conflict of interest The authors declare that they have no conflicts of interest with the contents of this article.

Figures

Figure 1
Figure 1
FUS promotes cell proliferation.A, schematic of the FUS gene targeting. Two guide RNAs, sgRNA1 and sgRNA2, were used to target FUS exon 4 (see Experimental procedures section). B, expression of FET proteins (FUS, EWSR1, and TAF15) in FUS−/− clones. C, reconstitution of FUS−/− (Cl.110) with an untagged FUS retroviral vector. The same vector expressing β-glucuronidase (GUS) was introduced as a negative control into FUS−/− cells. D, FUS−/− cell colonies exhibited reduced growth relative to FUS+/+ and FUS−/−:FUS cells. E, cell proliferation rates of FUS+/+, FUS−/−, and FUS−/−: FUS U-2 OS cells. Three biological replicates were used. The bars represent mean ± SE. The two-way ANOVA test was performed, and the p values shown on plot are adjusted p values by Tukey's multiple comparisons test. FUS, fused in sarcoma.
Figure 2
Figure 2
FUS is required for S-phase progression.A, DNA replication progression was analyzed by PI staining and flow cytometry. Cells were synchronized to G1/S boundary by double thymidine block and released into fresh growth medium for the indicated times and stained with PI for cell cycle analysis. B, DNA progression was monitored by EdU incorporation under the same conditions as in (A). Additional time points are presented in Fig. S5D. EdU, 5-ethynyl-2′-deoxyuridine; FUS, fused in sarcoma; PI, propidium iodide.
Figure 3
Figure 3
FUS deficiency leads to genomic instability and replication stress.A, replication fork speed is reduced in FUS−/− cells. The second pulse (CIdU) was used for measurement of track length, which was converted to micrometers using a 1 μm = 2.59 kb conversion factor. The average fork length was divided by 20 min to derive replication speed. B, replication fork restart was measured as shown in the schematic. Percentages of fork restart (percent of stalled forks) in HU-treated cells are shown. A and B, the representative DNA fiber images were included. Data are mean ± SD (n = 3). p Values were calculated using a t test with Welch's correction. ∗p < 0.05, ∗∗p < 0.01, ∗∗∗p < 0.001, and ∗∗∗∗p < 0.0001. C, FUS+/+, FUS−/−, and FUS−/−:FUS U-2 OS cells were treated with or without 0.2 μM aphidicolin (Aph) for 24 h, fixed, and stained with DAPI for micronucleus counting. p Values were calculated by two-way ANOVA test. Data are means ± SE (n = 3 biological replicates). More than 250 cells for each sample in each biological replicate were counted. CIdU, 5-chloro-2′-deoxyuridine; DAPI, 4′,6-diamidino-2-phenylindole; FUS, fused in sarcoma; HU, hydroxyurea; ns, no significance.
Figure 4
Figure 4
Reduced expression of replication-associated genes in FUS-deficient cells.A, enrichment plot of DNA replication pathway from GSEA using GO gene sets (biological process) in Table S2. B, heat map of differentially expressed DNA replication genes. Genes were clustered to three groups based on ward.D2 method. C, normalized RNA-Seq counts of cluster 2 genes involved in the DNA replication pathway. D, enrichment plot of DNA repair pathway from GSEA using GO gene sets (biological process) in Table S2. E, heat map of the leading gene list of DNA repair pathway showed significant change in all samples. Genes were clustered into two groups based on ward.D2 method. F, DNA repair–related gene expressions in cluster 1 were shown in normalized counts from RNA-Seq results. FUS, fused in sarcoma; GO, Gene Ontology; GSEA, gene set enrichment analysis.
Figure 5
Figure 5
FUS is required for efficient prereplication complex (pre-RC) loading.A, cell cycle profiles of FUS+/+, FUS−/−, and FUS−/−:FUS U-2 OS cells that were synchronized in early M phase with nocodazole (0.1 μg/ml for 16 h) and then harvested or released into G1 phase for 5 h. B, chromatin loading of ORC and pre-RC proteins in FUS+/+, FUS−/−, and FUS−/−:FUS U-2 OS cells. G1 fractions were immunoblotted with the indicated antibodies. CE, quantification of Western blotting results for soluble fractions (SFs, panel C), chromatin fractions (CFs, panel D), and whole-cell extracts (WCE, panel E) shown in panel B. Three independent biological replicates were used for the quantification. Data are means ± SE (n = 3 biological replicates). p Values were calculated by Student's t test for comparison between two samples. The expression of proteins in CF was normalized to lamin B1, SF were normalized to tubulin, and WCE were normalized with mean of lamin B1 and tubulin. FUS, fused in sarcoma; ORC, origin recognition complex.
Figure 6
Figure 6
FUS interacts with DNA repair and DNA replication factors.A, FUS-interacting proteins were identified by crosslinking chromatin immunoprecipitation (IP) and analyzed by MS. The results are combination of three biological replicates quantified by nonisotopic spectral peptide counting. The data shown are DNA repair and DNA replication pathway–related interactions based on GSEA (full list is shown in Fig. S6A). The unique peptides are summarized from the raw data of the three replicates. The gray dotted lines are 1.3 of fold change and 0.05 of p value. B, co-IP of FUS with POLD1, UHRF1, TOP1, and PCNA in unsynchronized cells. C, co-IP of FUS with FEN1 and PCNA in synchronized S-phase cells. D, in situ proximity ligation assay (PLA) was employed to verify the interactions between FUS and POLD1, PCNA, and FEN1. Nuclear regions were cycled by dashed lines in PLA red channel based on DAPI signal. E, quantification results of PLA signal in (D). The values are median of PLA foci in each sample. p Values were calculated by Wilcoxon test method. DAPI, 4′,6-diamidino-2-phenylindole; FUS, fused in sarcoma; GSEA, gene set enrichment analysis.
Figure 7
Figure 7
FUS regulates DNA replication timing (RT).A, asynchronous U-2 OS cells and three FUS−/− clones (Cl. 46, Cl. 65, and Cl. 110) were pulse labeled with EdU for 20 min and scored for the presence of early, mid, or late EdU staining patterns. B, quantification analysis of cell numbers of each S-phase patterns in (A) and the percentages were calculated in each sample. C, cells were synchronized with double thymidine and then released into S phase for indicated times. Cells were then pulse labeled with BrdU, stained, and imaged by confocal microscopy. D, quantification results of samples using a minimum 100 cells per sample (C). BrdU, 5-bromo-2′-deoxyuridine; EdU, 5-ethynyl-2′-deoxyuridine; FUS, fused in sarcoma.
Figure 8
Figure 8
FUS influences genome-wide RT.A, whole genome-wide replication timing profile of U-2 OS cells. The RT was calculated based on copy number variations between S- and G1-phase cells (S/G1 ratio). The signal was normalized by Z score and smoothed by Loess smoothing. B, representative RT profiles of FUS+/+, FUS−/−, and FUS−/−:FUS cells across two biological replicates. Regions of RT switching between FUS+/+ and FUS−/− are highlighted. C, correlation of RT between two biological replicates by Pearson's method. The smoothed RT values were used for the correlation matrix. D and E, genome-wide distribution of RT scores when comparing FUS+/+ to FUS−/− or FUS+/+versus FUS−/−:FUS in two biological replicates. The bin sizes are 50 and 100 for Replicate1 (Rep. 1) and Replicate2 (Rep. 2), respectively. FI, the RT density distribution for Rep. 2 was analyzed across all chromosomes (F), Chr.2 (G), Chr.5 (H), and Chr.20 (I). The RT density distribution for Rep. 1 is shown in Fig. S9, AD. The dashed lines are the median of each sample. The Loess smoothed data were used for analysis. FUS, fused in sarcoma; RT, replication timing.
Figure 9
Figure 9
Characterization of FUS-dependent replication domains (RDs).A, RT profiles were segmented into three states by nonsupervised package Segway as early RD (ERD), middle RD (MRD), and late RD (LRD). The domain numbers in each sample were plotted and labeled. The two biological replicates were merged for RD segmentation. B, percentages of genome coverage of RDs in each sample were calculated based on the segmentation. The values are percentages of each domain. C, the same RT domain sizes are compared among all the samples. The Student's t test was used for determination of significance. D, doughnut pie chart of FUS-dependent RD coverage. The percentage of each RD (ERD, MRD, and LRD; center pie) that is altered by FUS deficiency (FUS-dependent RDs) is shown in the outside layer, and the total percentage of each FUS-dependent RDs (ERD-FUS, MRD-FUS, and LRD-FUS) are calculated and shown in parentheses. The percentage was calculated based on the genome coverage. E, RT signal enrichment analysis of FUS-dependent replication domains in the samples. The average domain size is ∼106 bp C, and ∼0.5 × 106 bp flanking the midpoint was used for signal enrichment. Heat map results of RT signal enrichment of changing ERD, MRD, and LRD in all individual samples were shown in Fig. S9, EG. F, transcription signal in the centered FUS-dependent RDs. Transcription signal was normalized with CPM by STAR. G, RT signal enrichment around TSS, TES, and center of FUS-regulated gene regions across a ±0.5 Mb window. RT signal was calculated by log2 ratio of S/G1 samples in 20 kb bin after CPM normalization and followed with Z score normalization. Only FUS-regulated genes (listed in Table S3) annotation was used. H, Gene Ontology (GO) enrichment in biological function level of FUS-dependent RDs. The FUS-dependent RDs were extended 3000 bases in both ends, and then, the gene list under the extended FUS-dependent RDs was extracted and used for GO analysis. I, GO analysis in molecular function level of extended FUS-dependent RDs. FUS, fused in sarcoma; RT, replication timing; TES, transcription end site; TSS, transcription start site.
Figure 10
Figure 10
Working model of FUS in replication progression and replication timing.A, based on FUS chromatin proteomics, FUS specifically interacts with POLδ but not POLε. Many replication-coupled single-strand break (SSB) repair factors (PCNA, FEN1, and PARP1) were also enriched with FUS on chromatin. From this, we speculate that FUS facilitates Okazaki fragment processing and PARP-dependent repair of single-strand gaps on the lagging strand (67). Defects in this pathway may contribute to reduced RF speed, RF restart defects, and micronucleus formation. B, speculative model for FUS-dependent RT. FUS undergoes phase separation where it may interact transiently recruits RNA polymerase II, potentially in cooperation with EWSR1 and TAF15. Phase-separated FUS complexes (shown in green circles) organize chromatin into topologically distinct domains (ERD, MRD, and LRD) that are replicated during early, mid, and late S-phase, respectively. The DNA fiber and micronuclei images were reused from Figure 3 for illustration purpose only. ERD, early replication domain; FEN1, flap endonuclease-1; FUS, fused in sarcoma; LRD, late replication domain; MRD, mid replication domain; PARP1, poly(ADP)-ribosyl (PAR) polymerase 1; PCNA, proliferating cell nuclear antigen; POLδ, polymerase δ; RF, replication fork.

References

    1. Tan A.Y., Manley J.L. The TET family of proteins: Functions and roles in disease. J. Mol. Cell Biol. 2009;1:82–92. - PMC - PubMed
    1. Shang Y., Huang E.J. Mechanisms of FUS mutations in familial amyotrophic lateral sclerosis. Brain Res. 2016;1647:65–78. - PMC - PubMed
    1. Rabbitts T.H., Forster A., Larson R., Nathan P. Fusion of the dominant negative transcription regulator CHOP with a novel gene FUS by translocation t(12;16) in malignant liposarcoma. Nat. Genet. 1993;4:175–180. - PubMed
    1. Crozat A., Aman P., Mandahl N., Ron D. Fusion of CHOP to a novel RNA-binding protein in human myxoid liposarcoma. Nature. 1993;363:640–644. - PubMed
    1. Kwiatkowski T.J., Jr., Bosco D.A., Leclerc A.L., Tamrazian E., Vanderburg C.R., Russ C., Davis A., Gilchrist J., Kasarskis E.J., Munsat T., Valdmanis P., Rouleau G.A., Hosler B.A., Cortelli P., de Jong P.J. Mutations in the FUS/TLS on chromosome 16 cause familial amyotrophic lateral sclerosis. Science. 2009;323:1205–1208. - PubMed

Publication types

Substances