. 2021 Sep;597(7877):527-532.
doi: 10.1038/s41586-021-03855-y. Epub 2021 Aug 10.

Rare variant contribution to human disease in 281,104 UK Biobank exomes

Collaborators, Affiliations

Rare variant contribution to human disease in 281,104 UK Biobank exomes

Quanli Wang et al. Nature. 2021 Sep.

Abstract

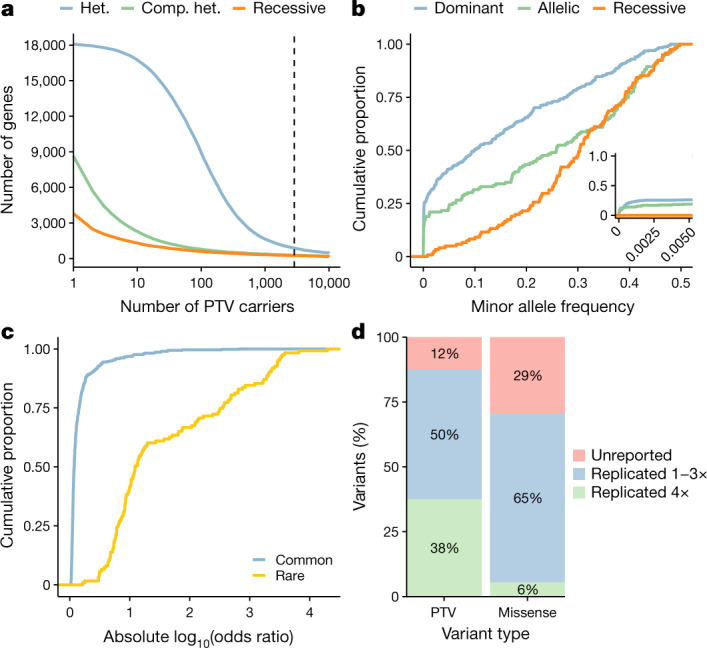
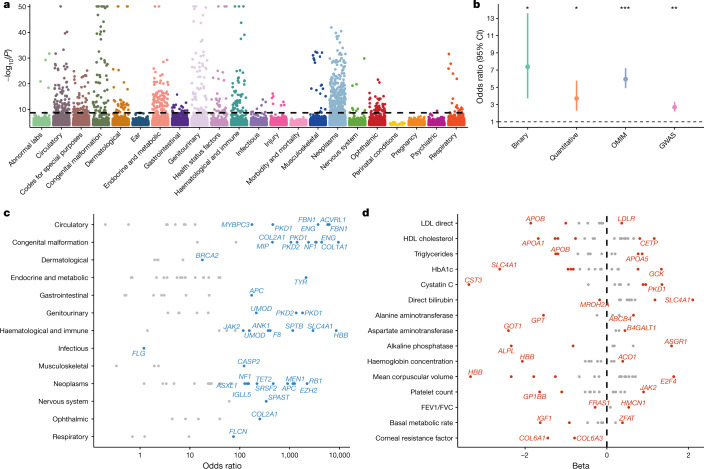
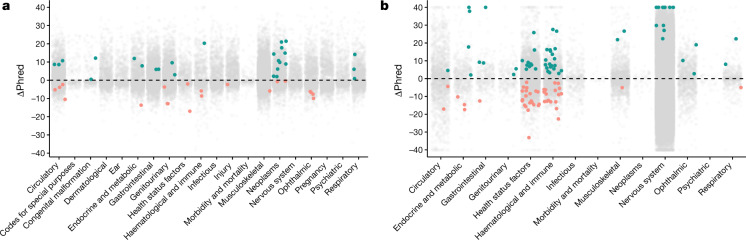
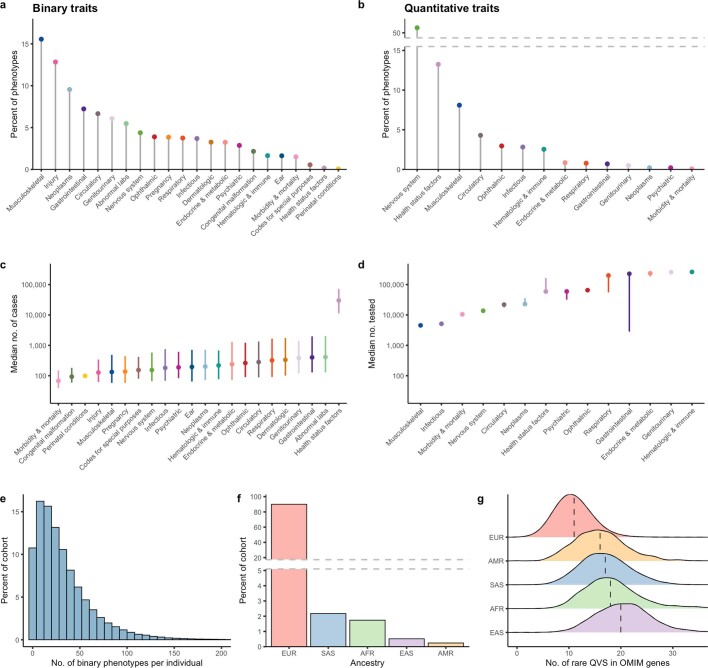
Genome-wide association studies have uncovered thousands of common variants associated with human disease, but the contribution of rare variants to common disease remains relatively unexplored. The UK Biobank contains detailed phenotypic data linked to medical records for approximately 500,000 participants, offering an unprecedented opportunity to evaluate the effect of rare variation on a broad collection of traits1,2. Here we study the relationships between rare protein-coding variants and 17,361 binary and 1,419 quantitative phenotypes using exome sequencing data from 269,171 UK Biobank participants of European ancestry. Gene-based collapsing analyses revealed 1,703 statistically significant gene-phenotype associations for binary traits, with a median odds ratio of 12.4. Furthermore, 83% of these associations were undetectable via single-variant association tests, emphasizing the power of gene-based collapsing analysis in the setting of high allelic heterogeneity. Gene-phenotype associations were also significantly enriched for loss-of-function-mediated traits and approved drug targets. Finally, we performed ancestry-specific and pan-ancestry collapsing analyses using exome sequencing data from 11,933 UK Biobank participants of African, East Asian or South Asian ancestry. Our results highlight a significant contribution of rare variants to common disease. Summary statistics are publicly available through an interactive portal ( http://azphewas.com/ ).


Conflict of interest statement

Q.W., R.S.D., K.C., A.R.H., A.N., I.T., D.V., S.V.V.D., A.M., D.M., M.H., S.M., H.O., S.W., K.R.S., R.M., A.P., C.H. and S.P are current employees and/or stockholders of AstraZeneca.

Figures

Fig. 1
Fig. 1. Summary of variant-level exome-wide association study results.
a, The number of genes (y axis) with at least the number of PTV carriers (x axis) in 287,917 UKB participants of any ancestry. The dashed line corresponds to the minimum number of carriers typically required to detect individual PTVs with a MAF > 0.5%, that is, 2,873 carriers. Colours represent heterozygous (het.), putative compound heterozygous (comp. het.) and homozygous/hemizygous carriers (recessive). b, The MAF distribution of 632 genome-wide significant ExWAS variants associated with binary traits. The inset plot represents the same data limited to variants with MAF < 0.5%. c, The distribution of effect sizes for 509 common versus 123 rare (MAF < 0.5%) significant ExWAS variants. The plots in b and c include variants with the largest effect sizes achieved per gene. d, Percentage of ExWAS study-wide significant PTVs (n = 24) and missense variants (n = 326) that reflect known or novel gene–phenotype relationships. Variants capturing known gene–phenotype relationships were partitioned into those validated in (1) at least one but not all, or (2) all four publicly available databases: FinnGen release r5, OMIM, the GWAS Catalog (including GWAS Catalog variants within a 50-kb flanking sequence either side of the index variant), and the ClinVar pathogenic/likely pathogenic variant collection.
Fig. 2
Fig. 2. Summary of gene-level collapsing analysis results.
a, Gene–phenotype associations for binary traits. For gene–phenotype associations that appear in multiple collapsing models, we display only the association with the strongest effect size. The dashed line represents the genome-wide significant P value threshold (2 × 10−9). The y axis is capped at −log10(P) = 50 and only associations with P < 10−5 were plotted (n = 94,208). b, Enrichment of FDA-approved drug targets, among significant binary traits, quantitative traits, OMIM genes and GWAS signals. P values were generated via two-sided Fisher’s exact test (*P < 10−5, **P < 10−20, ***P < 10−70). Exact statistics: binary odds ratio (OR) = 7.38, 95% CI: 3.71–13.59, P = 1.5 × 10−7; quantitative OR = 3.71, 95% CI: 2.28–5.76, P = 4.5 × 10−7; OMIM OR = 5.95, 95% CI: 4.90–7.23, P = 1.1 × 10−75; GWAS OR = 2.68, 95% CI: 2.12–3.32, P = 3.6 × 10−23). Error bars represent 95% CIs. Contingency tables were created using each of the binary (n = 195), quantitative (n = 395), OMIM (n = 3,875) and GWAS (n = 10,692) categories, alongside approved targets from Informa Pharmaprojects (n = 463). P values were generated via a two-tailed Fisher’s exact test. c, Effect sizes for select gene associations per disease area. Genes with the highest OR for a chapter or with OR > 100 are labelled. d, Illustration of large effect gene–phenotype associations for select disease-related quantitative traits. FEV1/FVC, forced expiratory volume in 1 s/forced vital capacity ratio; HDL, high-density lipoprotein; LDL, low-density lipoprotein. Dashed line corresponds to a beta of 0.
Fig. 3
Fig. 3. Pan-ancestry collapsing analysis.
a, b, The change in Phred scores between the pan-ancestry and European-only analyses for 46,769 binary associations (a) and 39,541 quantitative associations (b) stratified by chapter. For gene–phenotype associations that appear in multiple collapsing models, we display only those with the lowest P value. The green dots indicate associations that were not significant in the European analysis but were significant in the combined analysis. The orange dots represent associations that were originally significant in the European-only analysis but became not significant in the combined analysis. In both figures, the y axis is capped at ΔPhred = 40 (equivalent to a P value change of 0.0001).
Extended Data Fig. 1
Extended Data Fig. 1. Phenotypic and demographic diversity of the sequenced UK Biobank cohort.
a, The percentage of binary union traits assessed in the cohort per disease chapter. b, The percentage of quantitative traits assessed in the cohort per chapter. c, The median number of cases of European ancestry per binary union phenotype stratified by chapter with interquartile range depicted. The median number of European cases per binary union phenotype was 191 (interquartile range: 72-773). d, The median number of participants of European ancestry tested for quantitative traits stratified by chapter with interquartile ranges depicted. The median number of individuals tested for quantitative traits was 13,782 (interquartile range: 13,780-17,795). e, Histogram depicting the number of binary union phenotypes per patient. The x-axis was capped at 200 for visual clarity. The median number of binary union traits per European participant was 25 (interquartile range: 12-45) of a possible 4,911. f, The distribution of represented genetic ancestries in the sequenced cohort. EUR = European, SAS = South Asian, AFR = African, EAS = East Asian, AMR = American. g, The distribution of the number of rare (MAF <0.005%) qualifying variants (QVs) in OMIM-derived Mendelian disease genes per ancestral group. Error bars in (c, d) represent the interquartile range.
Extended Data Fig. 2
Extended Data Fig. 2. Rare PTVs and direction of variant effects.
a, The number of genes (y-axis) with at least N rare (MAF >0.01) protein-truncating variant (PTV) carriers (x-axis) in the cohort. Colours correspond to heterozygous (Het), putative compound heterozygous plus homozygous/hemizygous carriers (comp. het), and exclusively homozygous/hemizygous carriers (recessive). b, Distribution of the directions of effect for rare (MAF <0.1%) non-synonymous variant associations with quantitative phenotypes. Only phenotypes with at least five significant non-synonymous variant associations (P ≤ 2 × 10−9) in a given gene were considered.
Extended Data Fig. 3
Extended Data Fig. 3. Quantitative trait collapsing analysis.
Plot depicting significant gene-phenotype associations for quantitative traits. For gene–phenotype associations that appear in multiple collapsing models, we display only the association with the strongest effect size. The dashed line represents the genome-wide significant p-value threshold (2 × 10−9). The plot is capped at -log10(P) = 50 and only associations with P < 10-5 are included (n = 22,549).
Extended Data Fig. 4
Extended Data Fig. 4. Drug target enrichments.
Forest plots demonstrating enrichment of drug targets curated in DrugBank and the Informa Pharmaprojects databases among significant (Tier 1) and nearly significant (Tier 2) binary trait associations, quantitative trait associations, OMIM genes, and GWAS signals. P-values were calculated via Fisher’s exact test (two-sided). Error bars represent 95% confidence intervals of the Odds Ratio. The total numbers of genes per category are as follows: DrugBank-derived (n = 386); Approved from Informa Pharmaprojects (n = 463); Phase III from Informa Pharmaprojects (n = 474); Phase II from Informa Pharmaprojects (n = 1006); Phase I from Informa Pharmaprojects (n = 921); Collapsing – Binary (Tier 1 n = 82; Tier 2 n = 113); Collapsing - Quantitative (Tier 1 n = 269; Tier 2 n = 126); OMIM (n = 3875); GWAS (Tier 1 n = 8975; Tier 2 n = 1717).
Extended Data Fig. 5
Extended Data Fig. 5. Collapsing analysis comparisons.
a, Distribution of lambda (inflation factor) values across all collapsing models for binary and quantitative traits. b, Venn diagram for gene-trait associations identified by three studies using the first tranche of 50K UKB. There are 81 distinct significant gene-trait associations (P < 3.4x10⁻¹⁰) found among phenotypes that were studied by the three efforts (Supplementary Table 28). c, Percentage of suggestive binary gene-phenotype associations that became significant (sig) (P < 2x10⁻⁹), non-significant (non-sig) (P > 1x10⁻⁷) or remained suggestive (sugg) (2x10⁻⁹ < P < 1x10⁻⁷) with each successive UKB tranche release for binary traits (supplementary methods). 300Kv1 includes phenotypic data released up to April 2017, and 300Kv2 includes additional phenotypic data for the same set of samples released up to July 2020.
Extended Data Fig. 6
Extended Data Fig. 6. Pan-ancestry delta Phred distributions.
a, b, Distribution of the change between Phred ((-10*log10[p-values]) scores from the pan-ancestry collapsing analysis and the European-only collapsing analysis for binary traits (a) and quantitative traits (b). The x-axis in both figures are capped at -50 and +50.

References

    1. Bycroft C, et al. The UK Biobank resource with deep phenotyping and genomic data. Nature. 2018;562:203–209. doi: 10.1038/s41586-018-0579-z. - DOI - PMC - PubMed
    1. Szustakowski JD, et al. Advancing human genetics research and drug discovery through exome sequencing of the UK Biobank. Nat. Genet. 2021;53:942–948. doi: 10.1038/s41588-021-00885-0. - DOI - PubMed
    1. Plenge RM, Scolnick EM, Altshuler D. Validating therapeutic targets through human genetics. Nat. Rev. Drug Discov. 2013;12:581–594. doi: 10.1038/nrd4051. - DOI - PubMed
    1. Ashley EA. Towards precision medicine. Nat. Rev. Genet. 2016;17:507–522. doi: 10.1038/nrg.2016.86. - DOI - PubMed
    1. Harper AR, Nayee S, Topol EJ. Protective alleles and modifier variants in human health and disease. Nat. Rev. Genet. 2015;16:689–701. doi: 10.1038/nrg4017. - DOI - PubMed

Publication types